
FIGURE 3
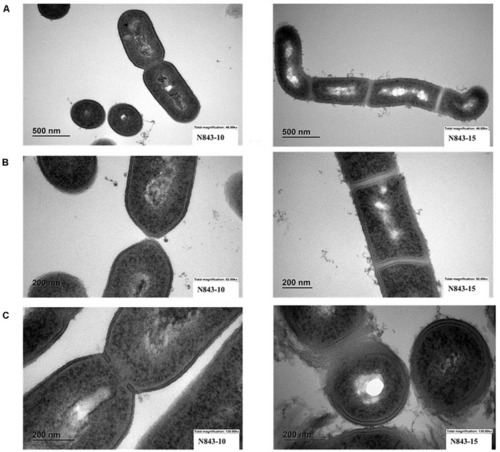
Electron microscopy (EM) reveals variations between N843_10 and N843_15 cell morphology. |