
Figure 6
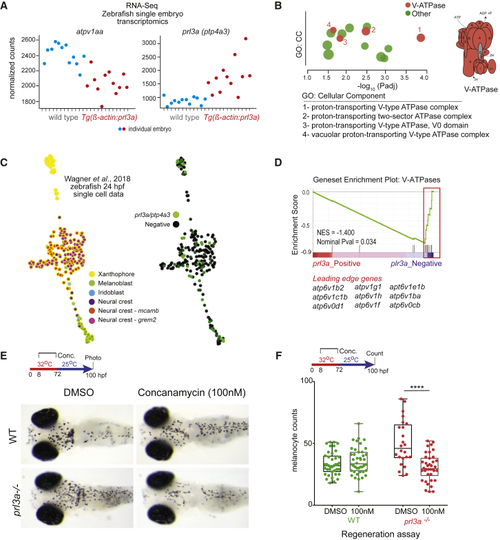
(A) Single embryo transcriptomics of heterozygote (B) g:Profiler output shows V-ATPase complex GO enrichment for (C) K-nearest neighbor graph (SPRING webtool) of (D) GSEA plotting enrichment of (E and F) (E) Images and (F) quantification of melanocytes in wild-type (WT) or |
Reprinted from Developmental Cell, 54(3), Johansson, J.A., Marie, K.L., Lu, Y., Brombin, A., Santoriello, C., Zeng, Z., Zich, J., Gautier, P., von Kriegsheim, A., Brunsdon, H., Wheeler, A.P., Dreger, M., Houston, D.R., Dooley, C.M., Sims, A.H., Busch-Nentwich, E.M., Zon, L.I., Illingworth, R.S., Patton, E.E., PRL3-DDX21 Transcriptional Control of Endolysosomal Genes Restricts Melanocyte Stem Cell Differentiation, 317-332.e9, Copyright (2020) with permission from Elsevier. Full text @ Dev. Cell