
Figure 5
- ID
- ZDB-FIG-200817-39
- Publication
- Zhou et al., 2020 - Zebrafish Retinal Ganglion Cells Asymmetrically Encode Spectral and Temporal Information across Visual Space
- Other Figures
- All Figure Page
- Back to All Figure Page
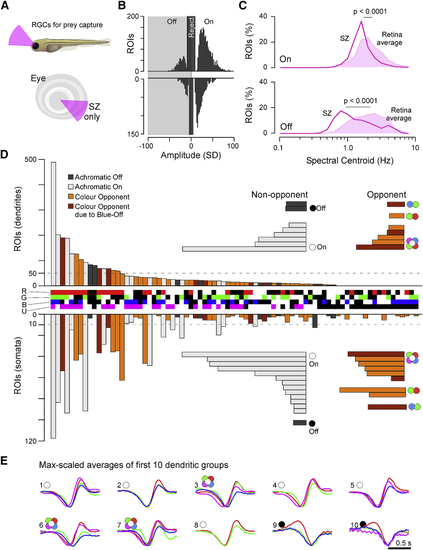
RGC Circuits in the Strike Zone (A) A second series of RGC imaging experiments as shown in (B) Overview of dominant On and Off responses among dendrites (top) and somata (bottom) for the SZ. Dendrites n = 2,370 On, n = 624 Off; somata n = 1,312 On, n = 379 Off. Chi-square with Yates correction for On:Off distributions dendrites versus somata: p < 0.22. For details, cf. (C) Relatively slowed central frequency tuning of SZ-UV kernels (lines) compared to the retina average of UV kernels (filled) among both On (top) and Off (bottom) kernels (cf. (D) Ternary spectral classification of SZ dataset (for details, cf. (E) Maximum amplitude scaled average kernels of the ten most abundant spectral classes among dendrites in (D). |