FIGURE

Figure 2

ID
ZDB-FIG-200817-36
Publication
Zhou et al., 2020 - Zebrafish Retinal Ganglion Cells Asymmetrically Encode Spectral and Temporal Information across Visual Space
Other Figures
All Figure Page
Back to All Figure Page
Figure 2

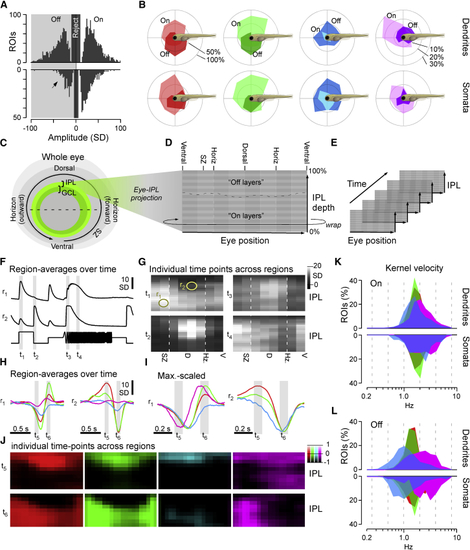
Major Functional Response Trends across the Eye

(A) Kernel amplitudes of all dendritic (top) and somatic (bottom; y-flipped) ROIs, shown for the maximal amplitude kernel of each ROI irrespective of color. For a breakdown by color, see Figures S2G and S2H. The arrowhead emphasizes a relative reduction in OFF responses at the level of somata. Chi-square with Yates correction for On:Off distributions dendrites versus somata: p < 0.00001.

(B) Prominence of different color and polarity responses among dendrites (top row) and somata (bottom row), plotted across visual space. In each case, all kernels that exceeded a minimum amplitude of 10 SDs were included. Scale bars in percent of dendritic/somatic ROIs that were recorded in a given section of the eye such that the percentages of On, Off, and non-responding (<10 SD) add to 100% are shown.

(C–E) Schematic illustrating how dendritic ROIs from different parts of the eye and IPL depth (C) were mapped into a 2D “Eye-IPL” map (D), which can then also be analyzed over time (E). Note that this involved “cutting” the circular range of eye positions such that the ventral retina is represented at either edge along the 2-projections’ x axis.

(F and G) Example snapshots of mean responses to chirp stimulation (cf. Figure 1G) mapped into an eye-IPL map as schematized above (C–E). Data can be plotted as time traces for a given region of the eye and IPL (F; r1,2 as indicated in G) or alternatively as a time-frozen snapshot of activity across the eye and IPL at different points in time (G; t1–4 as indicated in F). See also Videos S2 and S3.

(H–J) As (F) and (G) but instead showing mean kernels across the four spectral wavebands, where (H) and (I) are mean and max-scaled mean kernels for Eye-IPL regions r1,2 (as in F), respectively. (J) shows each kernel’s full Eye-IPL map at two time points t5,6 as indicated in (H) and (I) (see also Figure S2I). In the color scale bar, 0 equates to the baseline of each bin’s kernel and 1/−1 to their respective maximum or minimum (cf. I). See also Video S4.

(K and L) Distribution of central frequencies (STAR Methods) of dendritic (top) and somatic (bottom; inverted y axis) kernels in the four wavebands, separated into On (K) and Off (L) kernels. Wilcoxon rank-sum test, 1 tailed with correction for multiple comparisons for all pairwise comparisons between same polarity distributions of spectral centroids, is shown. Dendrites: all p < 0.001 except ROff versus GOff (p = 0.0011) and GOn versus BOn (p = 0.69). Somata: all p < 0.001 except ROn versus UOn (p = 0.00101), ROff versus GOff (p = 0.033), GOn versus BOn (p = 0.045), BOn versus UOn (p = 0.064), ROn versus BOn (p = 0.25), and ROn versus GOn (p = 0.57).

Expression Data

Expression Detail
Antibody Labeling
Phenotype Data

Phenotype Detail
Acknowledgments
This image is the copyrighted work of the attributed author or publisher, and ZFIN has permission only to display this image to its users. Additional permissions should be obtained from the applicable author or publisher of the image. Full text @ Curr. Biol.