
FIGURE 4
- ID
- ZDB-FIG-200808-6
- Publication
- Westhoff et al., 2020 - In vivo High-Content Screening in Zebrafish for Developmental Nephrotoxicity of Approved Drugs
- Other Figures
- All Figure Page
- Back to All Figure Page
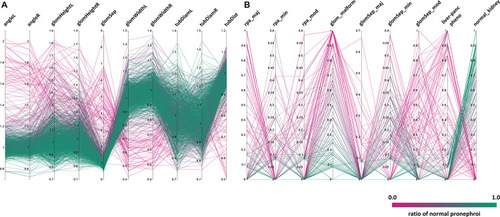
Distribution of phenotypic features upon compound treatment. Parallel coordinates plot visualizations showing the distribution of phenotypic features of pronephroi upon compound treatment. Each line plot represents a single compound treatment. In total, 1237 compound treatments are shown. The color of lines indicates the ratio of embryos within one treatment group scored as “normal_kidney” using manual annotation (from 0% (magenta, all abnormal) to 100% (green, all normal)). |