
FIGURE 5
- ID
- ZDB-FIG-200808-7
- Publication
- Westhoff et al., 2020 - In vivo High-Content Screening in Zebrafish for Developmental Nephrotoxicity of Approved Drugs
- Other Figures
- All Figure Page
- Back to All Figure Page
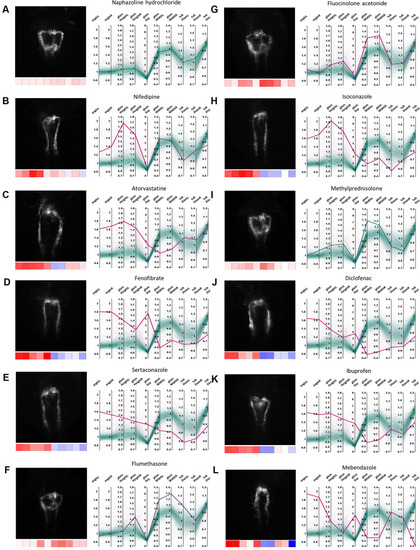
Examples of pronephric phenotypes. Illustrative examples of drug induced phenotypic changes for several compound classes. For each compound a thumbnail image, a heat map z-score visualization (below thumbnail) and a parallel coordinates plot of fold changes of quantitative morphological features are shown. In the parallel coordinates plots, thick lines indicate the shown compound and thin lines represent all other compound treatments; color codes as in |