
|
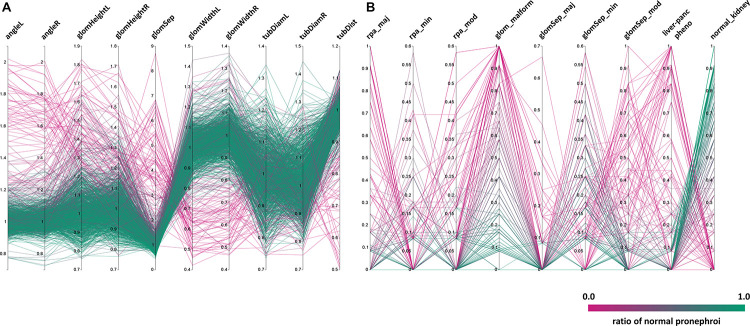
FIGURE 4
Distribution of phenotypic features upon compound treatment. Parallel coordinates plot visualizations showing the distribution of phenotypic features of pronephroi upon compound treatment. Each line plot represents a single compound treatment. In total, 1237 compound treatments are shown. The color of lines indicates the ratio of embryos within one treatment group scored as “normal_kidney” using manual annotation (from 0% (magenta, all abnormal) to 100% (green, all normal)).