|
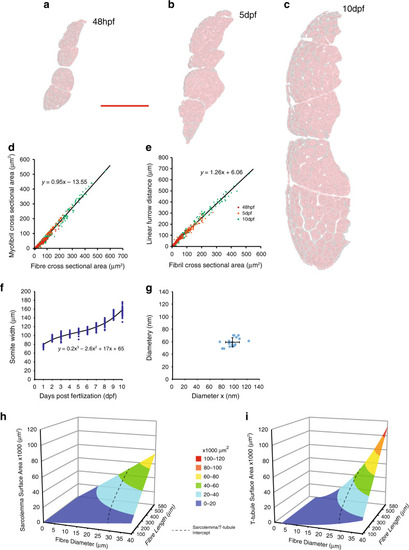
Mathematical model of T-tubule development.a–c Tracing of tiled TEM montages allows extraction of quantitative data. d Relationship between fibre cross-sectional area and myofibril cross-sectional area. e Relationship of myofibril cross-sectional area to linear furrow distance. f Somite width during the first 10 days post fertilisation n > 25 per time point. g Precise measurements from focussed ion beam volumes shows that T-tubules are elliptical (see also Fig. 2j) n = 17 tubules in one fish. h, i Application of the model for sarcolemmal and T-tubule surface area for muscle fibre sizes up to 40 µm diameter × 580 µm length. This was the maximum measured from a single 1 year old adult male. Dotted line shows the intersect of the two planes. Scale bar; (a–c) 50 µm.
|