|
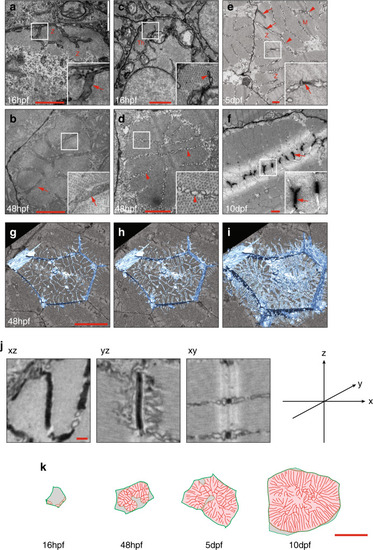
Ultrastructure of T-tubule development.a–f Transverse orientated transmission electron microscope (TEM) sections showing early T-tubules and sarcoplasmic reticulum. a, b Transverse sections through the Z line (Z) at 16 and 48 hpf. Electron dense, ferricyanide stained tubules are denoted by arrows. c, d Equivalent transverse sections taken towards the centre of the sarcomere, some distance from the Z-line. Arrowheads denote sarcoplasmic reticulum, which has an unstained lumen and a beaded appearance. e, f Oblique sections at 5 and 10 dpf show both ferricyanide stained, electron dense tubules (arrows) and sarcoplasmic reticulum (arrowheads). M, M-line, Z, Z-line. See also Supplementary Movie 3 (g–i) TEM images were derived from two individual animals per time point and specific observations described were noted in >12 individual cells. Serial blockface electron microscopy and 3D reconstruction shows association of T-tubules with myofibril furrows or splits at level of the Z-line (see also Supplementary Movie 3). Images are derived from two individual animals and images shown are representative of both (j) Single planes from a focussed ion beam volume enables precise measurements of tubule morphometrics (quantitative data are shown in Fig. 3g). This analysis is derived from one individual. k Tracing of TEM images illustrates the architecture of myofibril furrows and associated tubules. Red, tubules/furrows; pink, myofibrils; green, sarcolemma. Full masks are shown in Fig. 3a–c. These analyses are derived from one individual per time point. Scale bars; (a–f) 1 µm, (g, h) 10 µm, (j) 200 nm, (k) 10 µm.
|