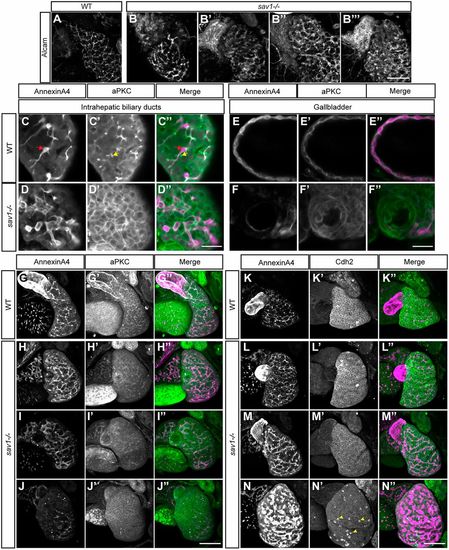
Hepatocyte apical domains appear abnormal and expanded in sav1−/− larvae. (A-B‴) Examples of wild-type (A) and sav1−/− (B-B‴) 8 dpf larvae whole-mount immunostaining for Alcam. n=5 wild type, n=6 sav1−/−. Scale bar: 100 μm. (C,D) Single plane images of intrahepatic biliary ducts stained for annexin A4 in wild-type and sav1−/− 8 dpf larvae respectively. Red arrow in C indicates one annexin A4+ biliary epithelial cell. (C′,D′) Single plane images of aPKC staining in wild-type and sav1−/− 8 dpf larvae, respectively. Yellow arrow in C′ indicates one canaliculus. (C″,D″) Merged images with green representing aPKC and magenta representing annexin A4. Scale bar: 25 μm. (E-F″) Examples of wild-type and sav1−/− gallbladder stained for aPKC and annexin A4, following the same labeling conventions as in C-D″. (G,G′) Z-projections of whole-mount staining for annexin A4 and aPKC in wild-type larvae at 8 dpf. Scale bar: 25 μm. (H,H′,I,I′,J,J′) Z-projections of whole-mount staining for annexin A4 and aPKC in sav1−/− larvae at 8 dpf. (G″,H″,I″,J″) Merged images with green representing aPKC and magenta representing annexin A4 (n=7 wild type; n=5 sav1−/−). Scale bar: 100 μm. (K-K″) Z-projections of whole-mount staining for annexin A4 and Cdh2 in wild-type larvae at 8 dpf. (L,L′,M,M′,N,N′) Z-projections of whole-mount staining for annexin A4 and Cdh2 in sav1−/− larvae at 8 dpf. Yellow arrowheads in N′ indicate examples of high intensity cytoplasmic punctate Cdh2 staining, suggesting cadherin junction collapse. (L″,M″,N″) Merged images of Cdh2 (green) and annexin A4 (magenta) (n=7 wild type; n=6 sav1−/−). Scale bar: 100 μm.
|
