FIGURE

6

ID
ZDB-FIG-200709-35
Publication
García-Poyatos et al., 2020 - Scaf1 promotes respiratory supercomplexes and metabolic efficiency in zebrafish
Other Figures
All Figure Page
Back to All Figure Page
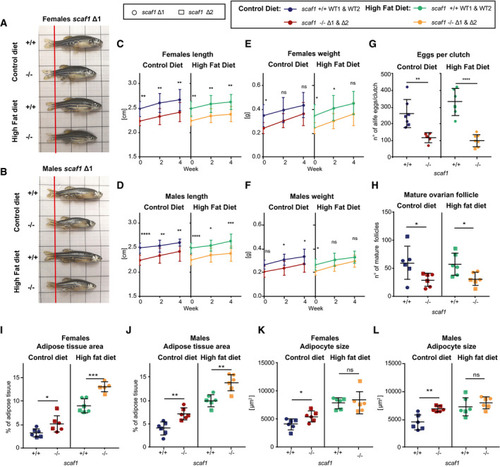
6

Lack of recovery of Scaf1<sup>−/−</sup> phenotypes after high‐fat diet

Representative images of scaf1−/− and scaf1+/+ females (A) and males (B) fed with the indicated diets.

Length of females (C) and males (D) after the indicated diets (Δ1 +/+ = 5, Δ1 −/− = 5, Δ2 +/+ = 5, Δ2 −/− = 5).

Weight of females (E) and males (F) after the indicated diets (Δ1 +/+ = 5, Δ1 −/− = 5, Δ2 +/+ = 5, Δ2 −/− = 5).

Number of eggs per clutch (control diet: Δ1 +/+ = 4, Δ1 −/− = 3, Δ2 +/+ = 3, Δ2 −/− = 2, high fat diet: Δ1 +/+ = 5, Δ1 −/−, = 5 Δ2 +/+ = 1, Δ2 −/− = 2).

Quantification of mature ovary follicles per ovary section in hematoxylin–eosin (H&E) histological sections (average of three sections/biological sample; Δ1 = 3, Δ2 = 3).

Adipose tissue quantification in H&E sections (Δ1 = 3, Δ2 = 3) in females (I, K) and males (J, L): adipose tissue area (I, J) and adipocyte size (K, L).

Data information: (C–F) Two‐way ANOVA. (G–L) Unpaired t‐test. Data are represented as mean ± SD. ns > 0.05, *< 0.05, **< 0.01, ***< 0.001, ****< 0.0001.

Expression Data

Expression Detail
Antibody Labeling
Phenotype Data
Fish:
Condition:
Observed In:
Stage: Adult

Phenotype Detail
Acknowledgments
This image is the copyrighted work of the attributed author or publisher, and ZFIN has permission only to display this image to its users. Additional permissions should be obtained from the applicable author or publisher of the image. Full text @ EMBO Rep.