|
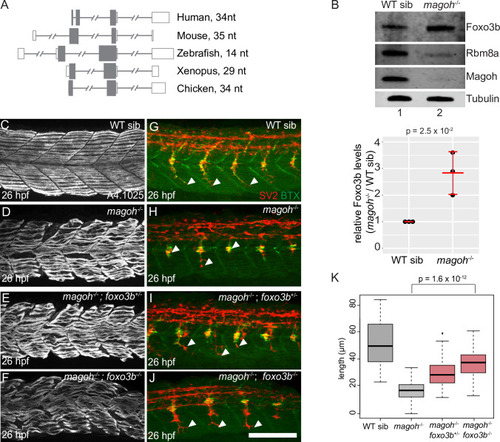
Partial or complete loss of <italic>foxo3b</italic> in <italic>magoh</italic> mutant embryos rescues motor neuron outgrowth defects.A. Illustration showing foxo3b gene structure in indicated vertebrates. The distance between the stop codon and the proximal 3′UTR intron is on the right. Open rectangles: UTRs, filled rectangles: coding region, gray lines: introns (hash marks denote shortened intron sequences). B. Top: Western blot showing protein levels in wild-type sibling (lane 1) and magoh mutant (lane 2) embryos at 21 hpf. Bottom: a dot plot showing Foxo3b levels normalized to tubulin levels in magoh mutant embryos and WT siblings at 21 hpf in three biological replicates. (N = 5 embryos per genotype per replicate). Error bars: standard error of means. C-F. Confocal images showing Myh1 immunofluorescence using anti-A4.1025 in somites 12–16 of WT sibling (C), magoh-/- mutant (D), magoh-/-; foxo3b+/- mutant (E), and magoh-/-; foxo3b-/- mutant (F) embryos at 26 hpf (N = 13 embryos/genotype). G-J. Merged confocal images showing motor neurons (red; detected by anti-SV2 staining) and acetylcholine receptors (green; detected by alpha-bungarotoxin staining) in somites 12–16 of WT sibling (G), magoh-/- mutant (H), magoh-/-; foxo3b+/- mutant (I), and magoh-/-; foxo3b-/- mutant (J) embryos. Neuromuscular junctions in the merged images are yellow. White arrowheads point to the distal end of the motor neuron. (N = 13 embryos per genotype). Scalebar in J (for panels C-J) is 100 nm. K. Boxplots showing quantification of motor axon length in embryos of genotypes indicated along the x-axis (4 motor neurons/embryo and 13 embryos/genotype). Welch’s t-test p-values for comparison between magoh-/- mutant and magoh-/-; foxo3b-/- mutant embryos are at the top.
|