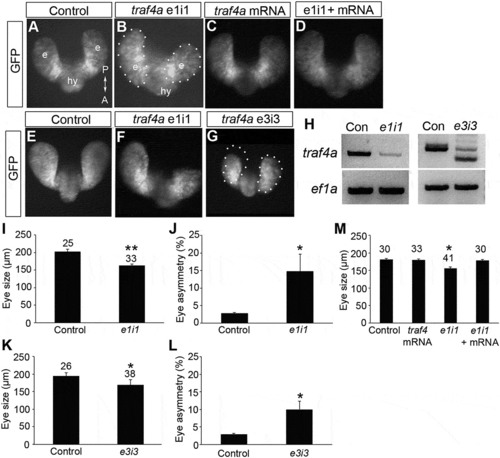
Traf4a knockdown results in small and asymmetric eye vesicles. A-G: Dorsal views of 12 ss (A-D) and 18 ss (E-G) Tg(rx3:GFP) control embryos (A,E), and embryos injected with either e1i1 MO (B,F), e3i3 MO (G), wild-type zebrafish traf4a mRNA (C), or e1i1 MO along with wild-type zebrafish traf4a mRNA (D). In G, the left eye vesicle outline is superimposed on the right eye. Morphant eye vesicles (outlined) are misshaped, and can be smaller in antero-posterior length. e, eye vesicle; hy, hypothalamus. H: RT-PCR showing knockdown or missplicing of the traf4a transcript with the e1i1 and the e3i3 antisense MOs, respectively, with ef1α as a loading control. I,K,M: Eye size (µm) as measured by the antero-posterior length of the shorter eye vesicle for 18 ss control, and e1i1 (I) and e3i3 (K) traf4a morphant embryos; 12 ss control embryos, and embryos injected with e1i1 with or without wild-type zebrafish traf4a mRNA (M). J,L: Mean percentage difference between the length of e1i1 (J) or e3i3 (L) embryos’ two eye vesicles. Error bars are standard deviation, and numbers above bars indicate number of embryos. Statistics (* p < 0.05, **, p < 0.01) represent: two-tailed, unpaired Student’s t-tests for I,K (N = 3) and J,L (N = 4); One Way ANOVA, Dunnett’s post-hoc test (M, N = 4).
|
