
Figure 1
- ID
- ZDB-FIG-200612-1
- Publication
- Tunbak et al., 2020 - Whole-brain mapping of socially isolated zebrafish reveals that lonely fish are not loners
- Other Figures
- All Figure Page
- Back to All Figure Page
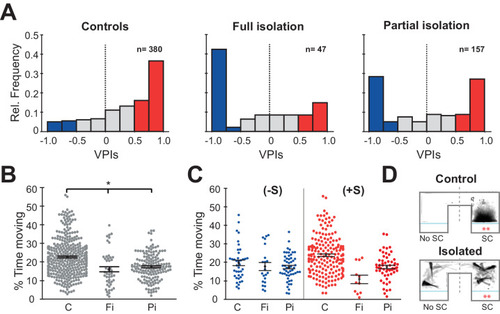
(A) Histograms of all the VPIs during the social cue period across different conditions: controls (C, left), full isolation (Fi, middle), and partial isolation (Pi, right). For visual clarity, red bars highlight strong pro-social fish (+S, VPIs > 0.5), blue bars anti-social fish(-S, VPIs < -0.5), and gray non-social fish (ns, -0.5 < VPI < +0.5). (B) Swarm plots comparing the activity levels of fish during the acclimation period expressed as percent time moving (C, n=380; Fi, n=47; Pi, n=157). Mean and standard errors are shown. (C) Swarm plots comparing the activity levels of anti-social (left) and social (fish) fish during visual social cue exposure for each rearing condition (C (-S), n=39; Fi (-S), n=21; Pi (-S), n=53) or (C (+S), n=193; Fi, n=11; Pi (+S), n=57). (D) Time projection through the video of a pro-social control, C(+S), and a fully isolated, Fi(+S), fish during social cue exposure. The dashed lines mark the division between the social cue side (SC) and the side without social cues (No SC) that was used to calculate VPI. |