
- Title
-
Whole-brain mapping of socially isolated zebrafish reveals that lonely fish are not loners
- Authors
- Tunbak, H., Vazquez-Prada, M.C., Ryan, T.M., Kampff, A.R., Dreosti, E.
- Source
- Full text @ Elife
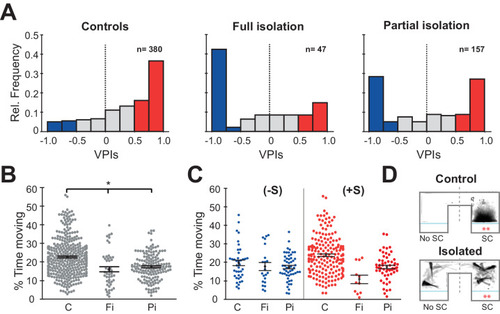
(A) Histograms of all the VPIs during the social cue period across different conditions: controls (C, left), full isolation (Fi, middle), and partial isolation (Pi, right). For visual clarity, red bars highlight strong pro-social fish (+S, VPIs > 0.5), blue bars anti-social fish(-S, VPIs < -0.5), and gray non-social fish (ns, -0.5 < VPI < +0.5). (B) Swarm plots comparing the activity levels of fish during the acclimation period expressed as percent time moving (C, n=380; Fi, n=47; Pi, n=157). Mean and standard errors are shown. (C) Swarm plots comparing the activity levels of anti-social (left) and social (fish) fish during visual social cue exposure for each rearing condition (C (-S), n=39; Fi (-S), n=21; Pi (-S), n=53) or (C (+S), n=193; Fi, n=11; Pi (+S), n=57). (D) Time projection through the video of a pro-social control, C(+S), and a fully isolated, Fi(+S), fish during social cue exposure. The dashed lines mark the division between the social cue side (SC) and the side without social cues (No SC) that was used to calculate VPI. |

( |
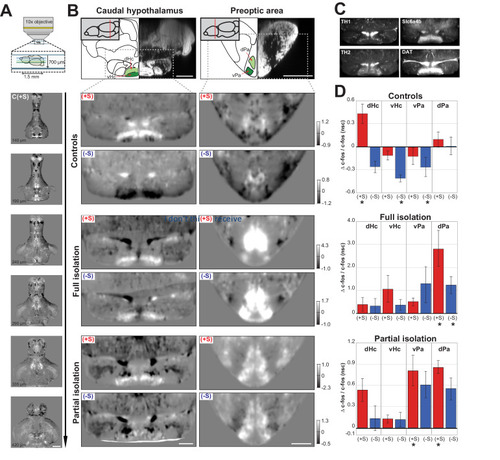
(A) Schematic of the custom-built two-photon microscope used for acquiring whole-brain volumes of dorsal-down mounted fish brains (top panel). Horizontal sections of pro-social control fish (C(+S)) responses at increasing imaging depth (lower panels). Images are average differences between (C(+S)) and siblings not presented with a social cue. Positive values (white) indicate increased cFos expression in socially preferring fish, while negative values (black) indicate decreased expression. Scale bar is 200?m. The intensity scale bar is shown in B, C(+S) row. (B) Region analysis of two different brain areas that have been implicated in social behavior: caudal hypothalamus and preoptic area. A schematic of the anatomical regions and corresponding DAPI staining is shown (top panel) with two sub-regions highlighted in green. Images showing changes in cFos activation in these areas for pro- (+S) and anti-social (-S) controls, fully isolated, and partially isolated fish are shown. Images are horizontal sections of the average difference between each test group and their corresponding sibling group not presented with a social cue. Scale bar is 100?m. Intensity scale bar is shown for each group. (C) Average image of TH1, TH2, Slc6a4b, and DAT expression in the same section of the caudal hypothalamus as 2B (n=3 each). Scale bar is 100?m. (D) Summary graphs showing the change in cFos activation for four different brain areas calculated by using the average difference images shown in (B) and using 3D masks (a single plane of each area of the masks is shown in green in B). Positive values indicate increases in cFos expression; asterisks mark significant changes relative to no social cue siblings. D=dorsal and V=ventral caudal hypothalamus; Pa=ventrolateral preoptic area, PM=dorsal preoptic area. |
( |

(A) Histogram of VPIs during the social cue period in partially isolated (Pi) fish treated with 30 ?M and 50 ?M of Buspirone (combined). For visual clarity, the bars are colored as in Figure 1. (B) VPI values calculated in one-minute time bins for controls (C, black line, n=380), partial isolated (Pi, blue line, n=157), and Pi treated with Buspirone (Pi+B, green line, n=118). Note how Buspirone treated fish recover normal social preference within the first 5 minutes. (C) Percentage of time moving calculated in one-minute bins for the same fish as B, thin lines indicate standard error. |

( |