
Figure 4—figure supplement 1.
- ID
- ZDB-FIG-200530-28
- Publication
- Lee et al., 2020 - Tgfb3 collaborates with PP2A and Notch signaling pathways to inhibit retina regeneration
- Other Figures
- All Figure Page
- Back to All Figure Page
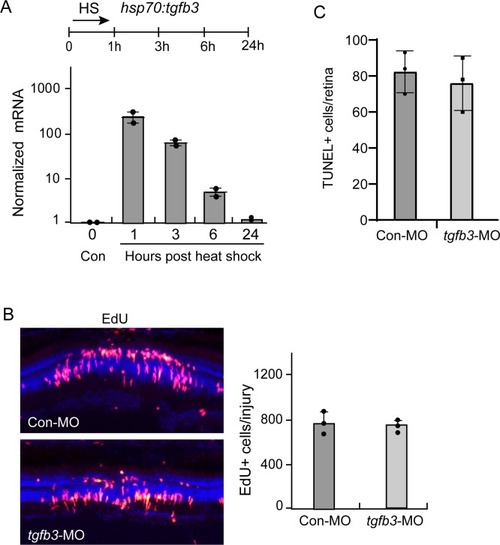
tgfb3 gene expression in hsp70:tgfb3 fish.(A) Heat shock induction of tgfb3 RNA in hsp70:tgfb3 transgenic fish. Top illustration is experimental time line. Bottom graph is qPCR quantification of tgfb3 gene expression. (B) Tgfb3 knockdown has no effect on MG proliferation in the injured retina. Control or antisense tgfb3-targeting MOs were electroporated into the retina at the time of injury and MG proliferation assayed at 4 dpi, 3 hr after receiving an IP injection of EdU. Left-hand panel is representative image of the injury site with EdU+ cells. Right-hand panel is quantification of EdU+ cells in the INL of the injured retina. (C) Quantification of TUNEL+ cells. |