
Fig. 4
- ID
- ZDB-FIG-200505-12
- Publication
- Schwarzer et al., 2020 - Neurogenesis in the inner ear: the zebrafish statoacoustic ganglion provides new neurons from a Neurod/Nestin-positive progenitor pool well into adulthood
- Other Figures
- All Figure Page
- Back to All Figure Page
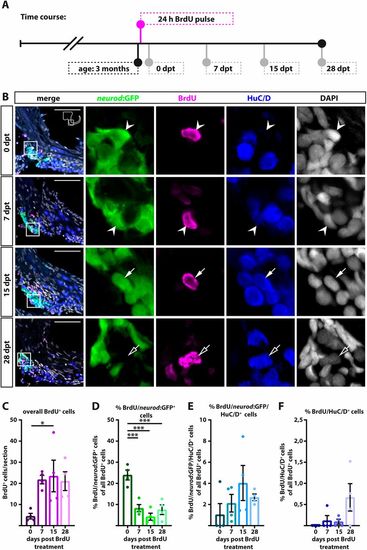
neurod:GFP-positive cells are proliferating and give rise to new neurons at juvenile stages. (A) Time course of the BrdU pulse chase experiment: 3-month-old Tg(neurod:GFP) zebrafish were sacrificed at 0, 7, 15 and 28 dpt. (B) Antibody staining shows BrdU/neurod:GFP-positive cells (0 and 7 dpt, arrowheads) which differentiate into BrdU/neurod:GFP/HuC/D-positive (15 dpt, solid arrows) and BrdU/HuC/D-positive neurons (28 dpt, open arrows). Panels on right show magnification of boxed areas in left panels. (C-F) Quantification of antibody staining. (C) The overall number of BrdU-positive cells increases from 0 dpt to later time points, indicating continued proliferation of precursor cells. (D) Percentage of BrdU/neurod:GFP-positive cells of all BrdU-positive cells decreases significantly from 0 dpt to later time points. (E) At 7 dpt, some BrdU/neurod:GFP-positive cells have already differentiated into immature BrdU/neurod:GFP/HuC/D-positive cells. (F) First newborn BrdU/HuC/D-positive neurons appear as early as 7 dpt and the percentage of BrdU/HuC/D positive neurons increases over time. Scale bars: 50 µm. Cross-sections show dorsal to the top and lateral to the right. For all quantifications n=4 (n=fish; 1 SAG/fish; 12 sections/SAG); data are presented as mean±s.e.m. Ordinary one-way ANOVA with Tukey's multiple comparison test. *P≤0.05; ***P≤0.001. |