|
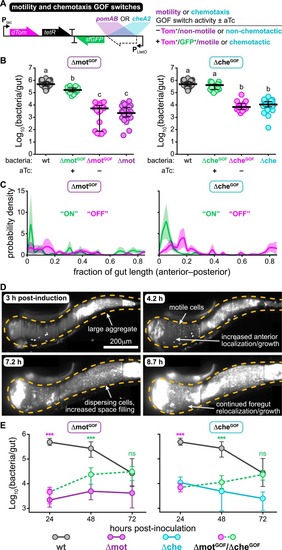
Acquisition of swimming motility or chemotaxis leads to rapid recovery of intestinal spatial organization and abundance.(A) Schematic of the motility and chemotaxis GOF switches. Table summarizes switch activity and bacterial behaviors +/− aTc. (B) ΔmotGOF or ΔcheGOF abundances 24 hpi +/− aTc. ΔmotGOF and ΔcheGOF were preinduced overnight in liquid culture prior to inoculation; aTc was maintained in the water for continuous switch activation. Abundances of wild-type Vibrio, Δmot, and Δche in wild-type hosts (from Fig 1A, 24 hpi) are shown for comparison. Bars denote medians and interquartile ranges. Letters denote significant differences. p < 0.05, Kruskal-Wallis and Dunn’s multiple comparisons test. (C) Probability densities showing the spatial distributions of ΔmotGOF and ΔcheGOF at 24 hpi. Magenta = uninduced; green = induced. Shaded regions mark standard errors. Sample sizes (populations within individual animals): ΔmotGOF “OFF”, n = 5; ΔmotGOF “ON”, n = 7, ΔcheGOF “OFF”, n = 6; ΔcheGOF “ON”, n = 6. (D) Maximum intensity projections acquired by LSFM from the same animal showing ΔcheGOF undergoing rapid changes in spatial organization following induction. Dashed lines mark approximate intestinal boundary. (E) Abundances of ΔmotGOF and ΔcheGOF over time. Magenta and green circles indicate abundances +/− aTc, respectively. Plotted are medians and interquartile ranges (n ≥ 19 animals/marker). Abundances of wild-type Vibrio, Δmot, and Δche (from Fig 1A) are shown for comparison. Significant differences between each mutant and wild-type determined by Mann-Whitney (magenta asterisks: uninduced; green asterisks: induced). ***p < 0.0001. Underlying data plotted in panels B, C, and E are provided in S1 Data. aTc, anhydrotetracycline; GOF, gain-of-function; hpi, hours post induction; LSFM, light sheet fluorescence microscopy; ns, not significant.
|