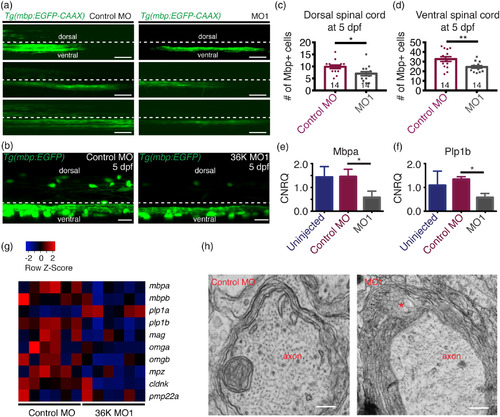
36K knockdown zfl have less and disrupted myelin. (a) Representative images depicting lateral view of the spinal cord at 4 dpf of Tg(mbp:EGFP‐caax) fish injected with control MO and MO1 showing dorsal and ventral spinal cord regions separated by a dotted line, with the region above this line being dorsal and the region below the line the ventral spinal cord. Scale bar: 40 μm. (b) Representative image depicting lateral view of two spinal segments above the yolk extension at 5 dpf in Tg(mbp:EGFP) zfl injected with control MO and MO1. Scale bars: 20 μm. (c,d) Number of mbp positive cells in two spinal segments were significantly fewer in both the (c) dorsal spinal cord (d) and in the ventral spinal cord. Unpaired two tailed t test p‐value 0.0182 (*) for (c). Unpaired two tailed t test p‐value .0087 (**) for (d). (e,f) q‐rt‐PCR data showing calibrated normalized relative quantities (CNRQ) for (e) mbpa and (f) plp1b. Target genes were normalized to ß‐actin and ef1a. N = 5. Kruskal–Wallis ANOVA p ≤ .05 (*) followed by Dunn's multiple comparisons test for control MO versus MO1. (g) Heatmap generated from microarray analysis. Color‐coded data (red = upregulation, blue = downregulation) showing expression levels of different myelin genes in rows and different batches of 3 dpf larvae in columns. (h) Transmission electron micrographs showing myelin sheets wrapped around axons in control MO and MO1 zfl at 5 dpf. Asterisk represents noticeable cytoplasmic vacuolated structures in between myelin lamellae in MO1 larva. Scale bars: 0.3 μm
|
