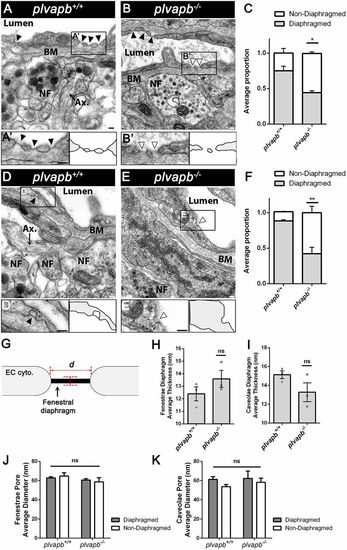
Ultrastructural analysis of fenestral and stomatal diaphragms in wild-type versus plvapb−/− zebrafish hypophyseal endothelium. (A,B) TEM imaging of diaphragmed (black arrowheads) and non-diaphragmed (white arrowheads) fenestrae in the adult zebrafish hypophysis. (A′,B′). Higher magnification and graphical depiction of diaphragmed and non-diaphragmed fenestrae. (C) Graph showing the proportion of diaphragmed and non-diaphragmed fenestrae in the plvapb+/+ versus plvapb−/− mutant fish. The proportion of diaphragmed and non-diaphragmed fenestrae was calculated in each blood capillary (5-25 capillaries per each biological repeat). The collated data of multiple capillaries measurements in each fish was averaged and plotted for each genotype. The proportion of complete diaphragms was significantly decreased in the mutant fish (*P<0.05; Welch two-sample t-test, n=3 for each genotype). (D,E) TEM imaging of diaphragmed (black arrowheads) and non-diaphragmed (white arrowheads) caveolae in the adult zebrafish hypophysis. (D′,E′) Higher magnification and graphical depiction of diaphragmed and non-diaphragmed caveolae. (F) Graph showing the proportion of diaphragmed and non-diaphragmed caveolae in the plvapb+/+ versus plvapb−/− mutant fish. The proportion of diaphragmed and non-diaphragmed fenestrae was calculated as in C. The proportion of complete stomatal diaphragms was significantly decreased in the mutant fish (**P<0.01; Welch two-sample t-test, n=3 for each genotype). (G-K) Quantitative analyses the morphological parameters of fenestral and caveolar diaphragms in the wild type versus plvapb−/− mutant. The collated data of 5-25 blood capillaries in each biological repeat was averaged and plotted for each genotype. (G) Scheme describing how the diaphragm thickness and pore diameter of fenestrae and caveolae were measured. (H,I) Graphs showing mean fenestral (H) and caveolar (I) diaphragm thickness. No significant difference were found between plvapb+/+ and plvapb−/− fish (ns, not significant; Welch two-sample t-test, n=3 for each genotype). (J,K) Graphs showing mean fenestral (J) and caveolar (K) pore diameter. No significant difference in the diameter of either diaphragmed or non-diaphragmed fenestral and caveolar openings was found between the plvapb+/+ and plvapb−/− fish (ns=not significant; two-way ANOVA, n=3 for each genotype). Data are presented as mean±s.e.m.; individual data points are shown in H and I. Ax., axonal element; BM, basement membrane; NF, nerve fiber. Scale bars: 100 nm. See related Figs S4, S5, S6 and S7.
|
