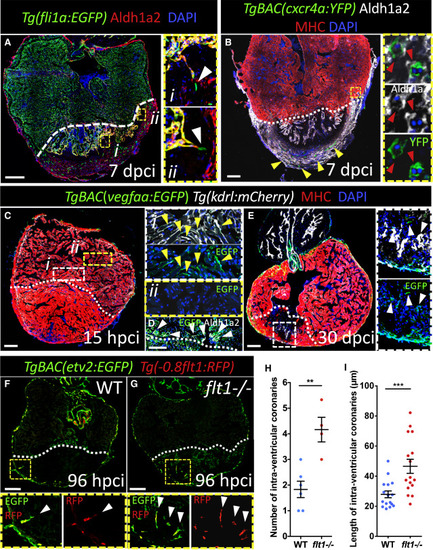
Vegfaa Signaling Directs Intra-ventricular Coronary Sprouting (A) 7 dpci ventricle stained for endothelium (green), Aldh1a2 (red), and DNA (blue). High-magnification images show intra-ventricular sprouting coronaries (EGFP+, Aldh1a2−) (white arrowhead) in close proximity to activated endocardium (EGFP+, Aldh1a2+) (n = 4). (B) 7 dpci ventricle stained for regenerating coronaries (green), Aldh1a2 (white), CMs (red), and DNA (blue). Regenerating superficial coronaries (yellow arrowheads). High-magnification images show a cross section of regenerating intra-ventricular coronaries surrounded by activated endocardium (n = 6) (red arrowheads). (C–E) 15 hpci (C and D) (n = 6) and 30 dpci (E) (n = 5) ventricles stained for vegfaa:EGFP expression (green), endocardium (white), CMs (red), activated endocardium ([D], white), and DNA (blue). High-magnification images of vegfaa:EGFP+ border zone endocardium (Ci; yellow arrowheads), endocardium distal to the injury (Cii), and vegfaa:EGFP+ activated endocardium (D and E; white arrowheads). (F and G) WT (F) and flt1−/− (G) ventricles stained for cardiac endothelium (green) and cECs (red). High-magnification images show intra-ventricular sprouting coronaries (white arrowheads). (H and I) Number (H) and length (I) of intra-ventricular coronaries in WT (n = 6) and flt1−/− (n = 4) animals at 96 hpci. White dotted lines delineate injured area. Data in graphs expressed as mean ± SEM. ∗∗p < 0.01, ∗∗∗p < 0.001. Scale bars: 100 μm. See also Figure S5.
|
