
Fig. S2
- ID
- ZDB-FIG-200318-32
- Publication
- Schwayer et al., 2019 - Mechanosensation of Tight Junctions Depends on ZO-1 Phase Separation and Flow
- Other Figures
- All Figure Page
- Back to All Figure Page
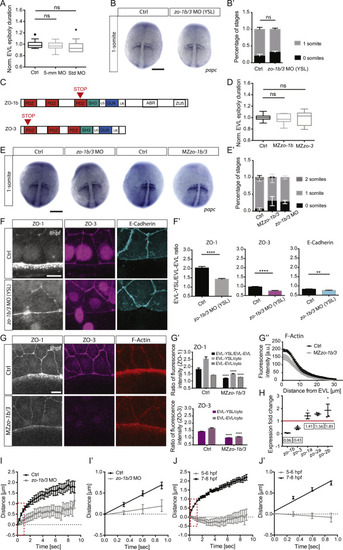
zo-1b/3 Mutant and Morphant Analysis, Related to Figure 2 (A) Plot of total time required for EVL to complete epiboly normalized to the average time needed by control (Ctrl) embryos injected with either phenol-red (Ctrl), zo-1b/3 5-base mismatch Ctrl MO (5mm-MO) or standard negative Ctrl MO (Std MO) into the YSL. Data are mean ± s.e.m. Kruskal-Wallis test with Dunn’s multiple comparisons test. Ctrl with N = 4, n = 14; zo-1b/3 MO with N = 3, n = 12; standard control MO with N = 3, n = 11. (B) Dorsal view of YSL-injected Ctrl (phenol-red, YSL-Ctrl) and zo-1b/3 morphant (YSL-morphant) embryos at 1-somite stage (10.5 hpf) labeled by in situ hybridization for papc outlining the forming somites. Scale bar, 200 μm. (B’) Bar plot of stage distribution (categorized in 0 and 1 somite stages as revealed by papc in situ hybridization) for the conditions described in (B). Data are mean ± s.e.m. 80% of Ctrl-YSL embryos and 69% of zo-1b/3 YSL-morphants showed 1 somite at 10.5 hpf. Mann-Whitney test. YSL-Ctrl with N = 3, n = 36; YSL-morphant with N = 3, n = 45. (C) Mutation sites in MZzo-1b and MZzo-3 mutants. Red triangles indicate the insertion sites of the STOP codon. (D) Plot of EVL tissue spreading, expressed as height of EVL (hEVL) normalized to total embryo height (hTOT), as a function of time normalized to average time needed by Ctrl embryos shown for wild-type (wt) Ctrl, and MZzo-1b and MZzo-3 single mutants. Data are mean ± s.e.m. One-way ANOVA with Tukey’s multiple comparisons test. Wt (Ctrl) with N = 4, n = 27; MZzo-1b with N = 3, n = 16; and MZzo-3 with N = 3, n = 18. (E) Dorsal view of Ctrl (phenol-red, Ctrl) and zo-1b/3 morphant embryos injected at the 1-cell stage, and of wt and MZzo-1b/3 mutant embryos labeled at 10.5 hpf by in situ hybridization for papc outlining the forming somites. Scale bar, 200 μm. (E’) Plot of stage distribution (categorized in 0, 1 and 2-somite stages as revealed by papc in situ hybridization) for the condition described in (E). 86% of Ctrl, 67% of MZzo-1b/3 embryos and 73% of zo-1b/3 morphants showed 1 somite at 10.5 hpf. Data are mean ± s.e.m. Cumulative link mixed model was used to determine p values in R. Ctrl versus MZzo-1b/3 mutants with p = 0.0002 and Ctrl versus zo-1b/3 morphants with p = 0.04. Ctrl with N = 2, n = 26; morphant with N = 3, n = 43; wt Ctrl with N = 4, n = 72 and mutant with N = 5, n = 77. (F) Maximum intensity projections (MIPs) of ZO-1 (left column), ZO-3 (middle column) and E-cadherin (right column) localization at the EVL-YSL boundary in YSL-Ctrl (upper row) and zo-1b/3 YSL-morphant (lower row) embryos at 8 hpf. ZO-1, ZO-3 and E-Cadherin were detected by immunohistochemistry. Scale bar, 20μm. (F’) Plot of EVL-YSL junctional intensity normalized to EVL-EVL junctional intensity at 8 hpf for the conditions described in (F). Data are mean ± s.e.m. Statistical test for ZO-1 intensity with Mann-Whitney test, ZO-3 intensity with unpaired t test and E-Cadherin intensity with unpaired t test; ZO-1: N = 2, YSL-Ctrl with n = 30 and zo-1b/3 YSL-morphant with n = 40; ZO-3: N = 2, YSL-Ctrl with n = 42 and zo-1b/3 YSL-morphant with n = 59. E-Cadherin: N = 3, Ctrl with n = 51 and zo-1b/3 YSL-morphant with n = 54. (G) MIPs of ZO-1, ZO-3 and F-actin localization at the EVL-YSL boundary in wt and MZzo-1b/3 mutant embryos at 8 hpf. ZO-1 and ZO-3 were detected by immunohistochemistry, and F-actin by Phalloidin. ZO-1 antibody likely detects both zebrafish ZO-1a and ZO-1b, suggesting that the remaining signal in the MZzo-1b/3 mutant reflects ZO-1a protein expression. (G’) Plot of EVL-YSL junctional intensity normalized to EVL-EVL junctional intensity, and EVL-YSL junctional intensity together with EVL-EVL junctional intensity normalized to cytoplasmic intensity at 8 hpf for the conditions shown in (G). Data are mean ± s.e.m. Statistical test for ZO-1: EVL-YSL/EVL-EVL with Mann-Whitney test, and EVL-YSL/cyto and EVL-EVL/cyto with unpaired t test; ZO-3: EVL-YSL/cyto and EVL-EVL/cyto with unpaired t test. N = 2, wt with n = 31 and MZzo-1b/3 mutant with n = 33. (G’’) Plot of F-Actin fluorescence intensity within the YSL as a function of distance from EVL margin for the conditions described in (D). F-actin was detected by Phalloidin. Data are mean ± SEM. [a.u.], arbitrary units. N = 2, wt with n = 7 and MZzo-1b/3 mutant with n = 7. (H) Compensatory expression changes of zo genes in MZzo-1b/3 mutant embryos normalized to the expression level of a housekeeping gene (elongation factor 1α). Fold change reflects the relative change of expression levels in MZzo-1b/3 mutant compared to wt embryos in qRT-PCR. Data are mean ± SEM. Red solid line indicates 1-fold change in expression, demarcating the boundary between increase (> 1) and decrease (< 1) of expression levels of the five different zo genes (N = 3). (I and J) Plot of junctional opening (distance in μm) of the EVL-YSL boundary marked by Myosin-2-GFP after UV laser cutting at late (8 hpf) stage of EVL epiboly in YSL-Ctrl and zo-1b/3 YSL-morphant (I) embryos and in wt embryos (J) at mid (6 hpf) and late (8 hpf) stages of EVL epiboly as a function of time after cutting. Data are mean ± SEM. Red dashed boxes indicate regions for calculation of initial recoil velocity shown in (I’,J’). (I’ and J’) Plot of the first four time-points from (I,J) with linear fit to extract initial recoil velocity shown in Figures 2E’’ and 2F’’). Data are mean ± SEM. N,n see (Figures 2E–2F). ∗∗∗∗p < 0.0001; ∗∗p < 0.01; ns, not significant; n, number of embryos (A, B’, D, E’, and G’’) and cells (F’ and G’). |
Reprinted from Cell, 179, Schwayer, C., Shamipour, S., Pranjic-Ferscha, K., Schauer, A., Balda, M., Tada, M., Matter, K., Heisenberg, C.P., Mechanosensation of Tight Junctions Depends on ZO-1 Phase Separation and Flow, 937-952.e18, Copyright (2019) with permission from Elsevier. Full text @ Cell