
Fig. S1
- ID
- ZDB-FIG-200318-30
- Publication
- Schwayer et al., 2019 - Mechanosensation of Tight Junctions Depends on ZO-1 Phase Separation and Flow
- Other Figures
- All Figure Page
- Back to All Figure Page
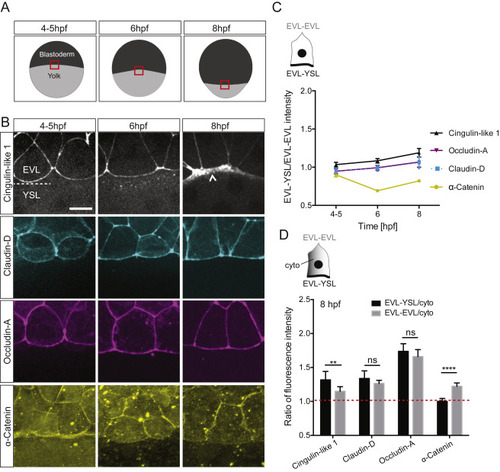
TJ and AJ Component Localization at the EVL-YSL Boundary, Related to Figure 1 (A) Schematic representation of EVL spreading during consecutive stages of epiboly (4-5, 6 and 8 hpf). Yolk cell, light gray; blastoderm (EVL and deep cells), dark gray. Red rectangle demarcates regions of the EVL-YSL boundary shown in (B). (B) Maximum intensity projections (MIPs) of GFP-Cingulin-like 1, GFP-Claudin-D, Occludin-A-mNeonGreen and α-Catenin localization at the EVL-YSL boundary at 4-5, 6 and 8 hpf. α-Catenin is visualized by immunohistochemistry, Cingulin-like 1 and Claudin-D and Occludin-A by expression of their respective GFP- or mNEONgreen-fusion constructs, respectively, in wild-type embryos. White arrowheads point to increased accumulation at the EVL-YSL boundary. Scale bar, 20 μm. (C) Plot of EVL-YSL junctional intensity normalized to EVL-EVL junctional intensity as a function of time during EVL epiboly (see also schematic above). Data are mean at 95% confidence. Cingulin-like 1 with N = 2, n = 33 at 4-5 hpf, n = 37 at 6 hpf and n = 31 at 8 hpf. Claudin-D with N = 2, n = 40 at 4-5 hpf, n = 50 at 6 hpf, n = 29 at 8 hpf. Occludin-A with N = 2, n = 27 at 4-5 hpf; N = 2, n = 54 at 6 hpf; N = 3, n = 43 at 8 hpf. α-Catenin with N = 2, n = 45 at 4-5 hpf, n = 29 at 6 hpf, n = 28 at 8 hpf. (D) Plot of EVL-YSL junctional intensity (black) and EVL-EVL junctional intensity (gray) normalized to cytoplasmic intensity at 8 hpf. Red dashed line indicates ratio of 1 demarcating the boundary between accumulation (> 1) and depletion (< 1). Data are mean at 95% confidence. Cingulin-like 1 with N = 2, n = 30. Claudin-D with N = 2, n = 29 cells. Occludin-A with N = 3, n = 43. α-Catenin with N = 2, n = 28. Cingulin-like 1, Claudin-D and Occludin-A with Mann-Whitney test. α-Catenin with Unpaired t test. ∗∗∗∗p < 0.0001; ∗∗p < 0.01; ns, not significant; n, number of cells. |
Reprinted from Cell, 179, Schwayer, C., Shamipour, S., Pranjic-Ferscha, K., Schauer, A., Balda, M., Tada, M., Matter, K., Heisenberg, C.P., Mechanosensation of Tight Junctions Depends on ZO-1 Phase Separation and Flow, 937-952.e18, Copyright (2019) with permission from Elsevier. Full text @ Cell