
FIGURE
Fig 2
- ID
- ZDB-FIG-200310-18
- Publication
- Mauro et al., 2019 - Protocol development for discovery of angiogenesis inhibitors via automated methods using zebrafish
- Other Figures
- All Figure Page
- Back to All Figure Page
Fig 2
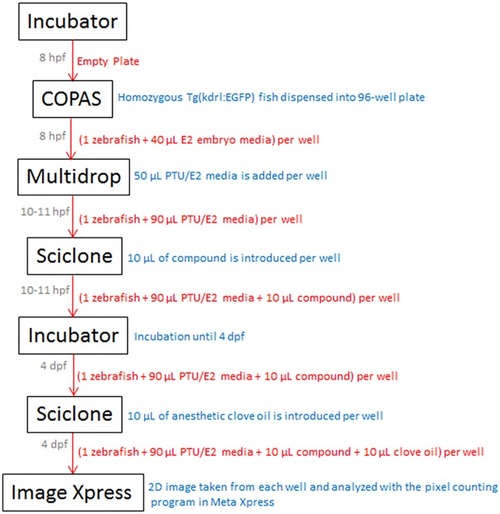
Grey font: time of plate movement. Red font: contents of plate while in transit between devices. Blue font: action taken at device. |
Expression Data
Expression Detail
Antibody Labeling
Phenotype Data
Phenotype Detail
Acknowledgments
This image is the copyrighted work of the attributed author or publisher, and
ZFIN has permission only to display this image to its users.
Additional permissions should be obtained from the applicable author or publisher of the image.
Full text @ PLoS One