
Image
|
Figure Caption
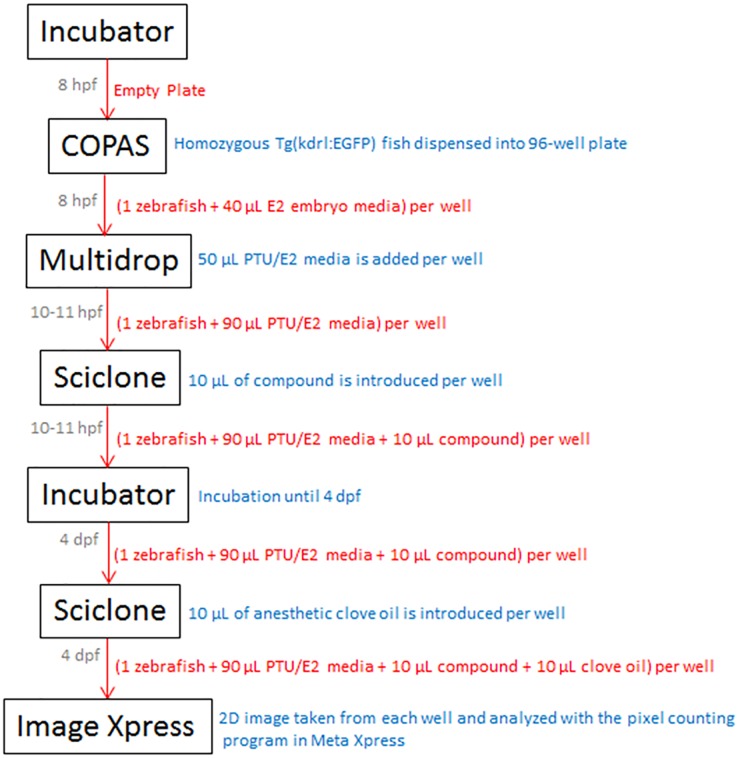
Fig 2
Grey font: time of plate movement. Red font: contents of plate while in transit between devices. Blue font: action taken at device.
Acknowledgments
This image is the copyrighted work of the attributed author or publisher, and
ZFIN has permission only to display this image to its users.
Additional permissions should be obtained from the applicable author or publisher of the image.
Full text @ PLoS One