
FIGURE
Fig 3
- ID
- ZDB-FIG-200310-19
- Publication
- Mauro et al., 2019 - Protocol development for discovery of angiogenesis inhibitors via automated methods using zebrafish
- Other Figures
- All Figure Page
- Back to All Figure Page
Fig 3
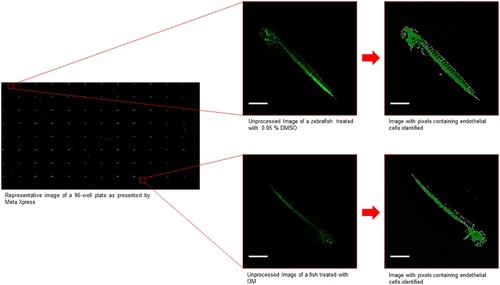
The image on the left is a composite of 2D images from each of the wells of a 96-well plate as presented by MetaXpress. The images on the right are blown up unprocessed and processed images from a well with 0.05% DMSO (negative control) and a well with 8 μM I3M (angiogenesis inhibitor). Scale bar is 700 μm. |
Expression Data
Expression Detail
Antibody Labeling
Phenotype Data
Phenotype Detail
Acknowledgments
This image is the copyrighted work of the attributed author or publisher, and
ZFIN has permission only to display this image to its users.
Additional permissions should be obtained from the applicable author or publisher of the image.
Full text @ PLoS One