
FIGURE
Figure 3—figure supplement 1—source data 1.
- ID
- ZDB-FIG-200220-43
- Publication
- He et al., 2020 - In vivo single-cell lineage tracing in zebrafish using high-resolution infrared laser-mediated gene induction microscopy
- Other Figures
- All Figure Page
- Back to All Figure Page
Figure 3—figure supplement 1—source data 1.
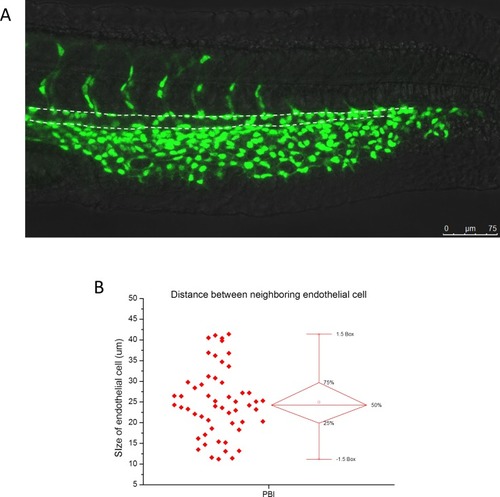
Size of endothelial cells on the ventral wall of aorta in the PBI region.(A) The representative fluorescence image of a 28 hpf Tg(kdrl:GFP; kdrl:nlsEOS) zebrafish with endothelial nuclei labeled by nls-EOS (green). The region marked by dashed lines indicates aorta in the PBI. (B) Statistics of the distance between the nuclei of neighboring endothelial cells on the aortic floor (bottom dashed line in (A)) in the PBI region. The average distance is 24.9 µm and the standard deviation is 8.2 µm. The total number of endothelial cells is 54 from three zebrafish. |
Expression Data
Expression Detail
Antibody Labeling
Phenotype Data
Phenotype Detail
Acknowledgments
This image is the copyrighted work of the attributed author or publisher, and
ZFIN has permission only to display this image to its users.
Additional permissions should be obtained from the applicable author or publisher of the image.
Full text @ Elife