
IMAGE
Figure 3—figure supplement 1—source data 1.
- ID
- ZDB-IMAGE-200220-42
- Source
- Figures for He et al., 2020
Image
|
Figure Caption
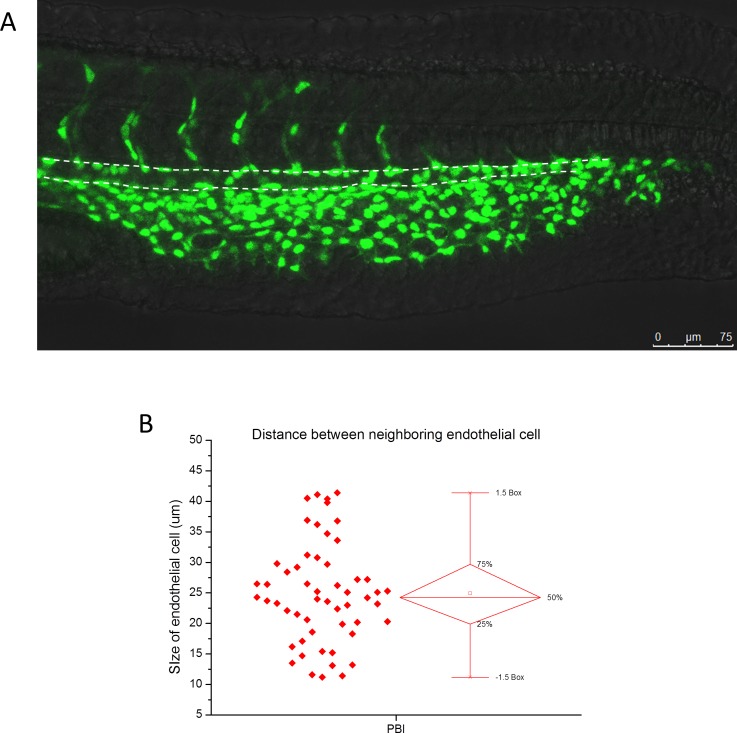
Figure 3—figure supplement 1—source data 1.
Size of endothelial cells on the ventral wall of aorta in the PBI region.
(A) The representative fluorescence image of a 28 hpf Tg(kdrl:GFP; kdrl:nlsEOS) zebrafish with endothelial nuclei labeled by nls-EOS (green). The region marked by dashed lines indicates aorta in the PBI. (B) Statistics of the distance between the nuclei of neighboring endothelial cells on the aortic floor (bottom dashed line in (A)) in the PBI region. The average distance is 24.9 µm and the standard deviation is 8.2 µm. The total number of endothelial cells is 54 from three zebrafish.
Acknowledgments
This image is the copyrighted work of the attributed author or publisher, and
ZFIN has permission only to display this image to its users.
Additional permissions should be obtained from the applicable author or publisher of the image.
Full text @ Elife