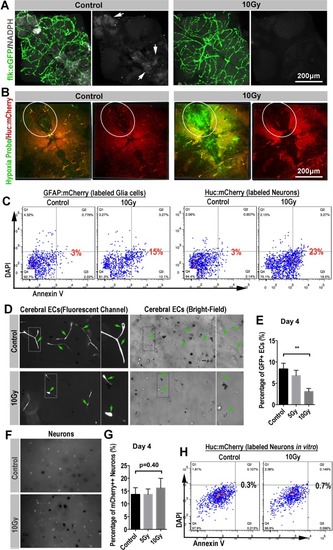
Secondary blood-perfusion insufficiency induced the apoptosis of neuron and glial (in vivo/in vitro). (A) Example of images (each representative of 6 zebrafishes) depicting endothelial cells (green) of cerebral capillaries (left) and spontaneous fluorescence (white) of NADPH (right) in 0 and 10 Gy group at 4-day post radiation. Scale bars, 100 µm. (B) Example of images (each representative of 6 zebrafishes) depicting intracranial injection of hypoxia probe (green) and neurons (red) of HuC:mCherry zebrafish in 0 and 10 Gy group at 4-day post radiation. The boxed areas indicated the changes in severity of hypoxia and changes in the number of neurons between 0 and 10 Gy groups. Scale bars, 100 µm. (C) In vivo, glial cells (GFAP:mCherry zebrafish lines) and neurons (HuC:mCherry zebrafish lines) were gated for apoptosis staining in control and 10 Gy group at 4-day post radiation (n = 6 zebrafishes per group). (D) Example of images (each representative of 6 visions) depicting vitro 3-D culture of cerebral endothelial cells in 0 and 10 Gy groups at the fluorescence channel (left) and bright field (right). The arrowheads and boxes indicate the apoptosis of endothelial cells in 10 Gy group compared with 0 Gy group. (E) Flow analysis of percentage of endothelial cells in vitro 3-D culture at 4-day post radiation among 0, 5 and 10 Gy groups. (F) Example of images (each representative of 6 visions) depicting vitro 3-D culture of neurons (white) in 0 and 10 Gy groups at 4-day post radiation. (G) Flow analysis of percentage of neurons in vitro 3-D culture at 4-day post radiation among 0, 5 and 10 Gy groups. (H) Neurons (HuC:mCherry zebrafish lines) in vitro 3-D culture were gated for apoptosis staining in 0 and 10 Gy group at 4-day post radiation (n = 6 zebrafishes per group). Statistical analysis in (E,G) was performed using t-test: **P < 0.05, ***P < 0.01. Data represent the mean ± s.e.m.
|
