|
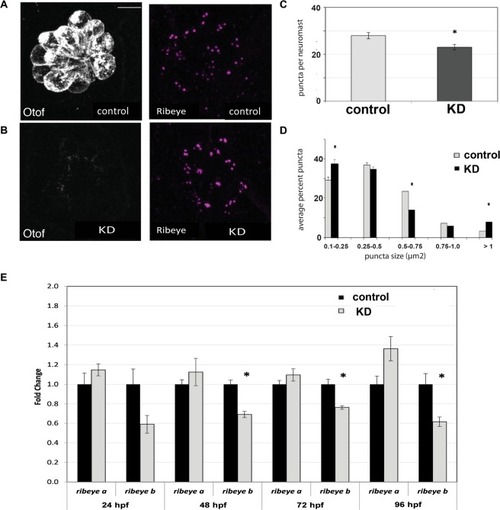
Effects of otoferlin depletion on synaptic morphology in posterior lateral line neuromasts of 96 hpf zebrafish larvae. (A,B) Representative confocal z-projection images of neuromasts from control injected (A) and otoferlin morphant (B) larvae immunolabeled with anti-otoferlin (HCS-1), and anti-Ribeye. (C) Average number of Ribeye puncta counted per neuromast in negative control injected (no. of neuromasts = 20) and morphant (no. of neuromasts = 18) larvae (t-test, p-value < 0.0001). Error bars indicate s.e.m. (D) Average percent of Ribeye puncta per neuromast that fell within size bins of 0.1–0.25, 0.25–0.5, 0.5–0.75, 0.75–1.0, and >1.0 µm2, in control injected (no. of neuromasts = 20) and morphant (no. of neuromasts = 18) larvae (t-test, p-value < 0.0001), Error bars indicate s.e.m. (E) Expression of ribeye transcripts in control and morphant larvae at 24, 48, 72, and 96 hpf, N = 4 per time point (t-test, p-value < 0.05). Scale bars = 5 µm.
|