
Figure 6
- ID
- ZDB-FIG-191230-86
- Publication
- Harrison et al., 2019 - Late developing cardiac lymphatic vasculature supports adult zebrafish heart function and regeneration
- Other Figures
-
- Figure 1
- Figure 1—figure supplement 1.
- Figure 2—figure supplement 1.
- Figure 2.
- Figure 3
- Figure 3—figure supplement 1.
- Figure 3—figure supplement 2.
- Figure 4
- Figure 4—figure supplement 1.
- Figure 5
- Figure 5—figure supplement 1.
- Figure 6
- Figure 6—figure supplement 1.
- Figure 6—figure supplement 2.
- Figure 6—figure supplement 3
- Figure 6—figure supplement 4.
- Figure 6—figure supplement 5.
- All Figure Page
- Back to All Figure Page
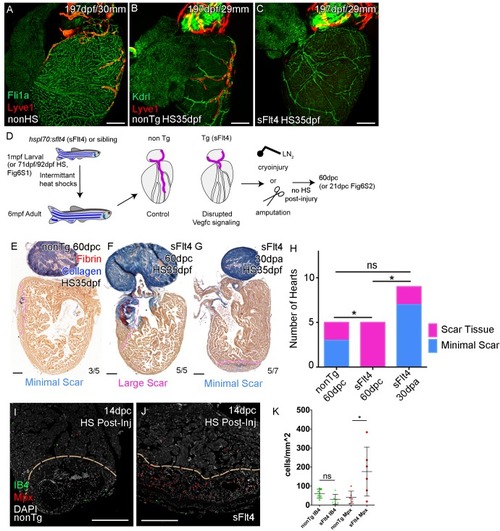
Whole-mount confocal imaging of adult transgenic zebrafish hearts expressing the pan-endothelial fli1a:GFP (green: A), Arterially and endocardially enriched endothelial marker kdrl:GFP (green: B, C), lymphatic endothelial marker lyve1:RFP (Red: A-C). (A) Heart with normal cardiac lymphatic vessels from stage and size-matched control zebrafish (nonHS, n = 7). (B) Hearts from non-Transgenic zebrafish (nonTg, n = 3) that are exposed to heat shock with cardiac lymphatic vessels on the heart that extend further and cover more of the ventricle. (C) In contrast, hearts from hsp70l:sflt4 zebrafish (sFlt4, n = 7), heat shocked in the same way lack extension of the cardiac vasculature onto the ventricle. (D) Schematic representation of the experimental procedure and regulation of cardiac lymphatic development by inducing sFlt4. AFOG-histology images showing fibrin in red and collagen in blue in developmentally heat shocked (1 to 6mpf) non-transgenic (nonTg; E) and transgenic (hsp70l:sflt4; sFlt4; F and G) zebrafish 60 days following severe cryoinjury (60dpc, 8mpf, E and F) or 30 days after apex resection (30dpa, 7mpf, G). Scar volume was estimated and grouped based on severity for cryoinjured hearts (minimal scar,<0.005 mm3, E; large scar,>0.005 mm3, F) and amputated hearts (minimal scar, G). (H) Graph showing the distribution of tissue scaring between non-transgenic (nonTg, n = 5) and transgenic (hsp70l:sflt4) zebrafish at 60dpc (sFlt4, n = 5) and 30dpa (n = 7), *p<0.05, two-tailed Chi-Squared. Fluorescence signal from immuno-labeled neutrophils (Mpx; Red: I and J) and Macrophage (IB4; green: I and J) in and near the 14dpc woundsite (demarked orange; Post-injury sFlt4 induction, n = 6 per group). (J) Elevated level of Mpx-positive immune cells at the 14dpc woundsite of fish with post-injury induced sFlt4 (n = 6). (K) Separate quantification of Mpx and IB4-positive cells in and within 100 μm of the 14dpc woundsite (average of at least three images through woundsite, individually normalized to woundsite area, n = 6 per group). *p<0.05; **p<0.01; ***p<0.001, unpaired t-test, Mean and SD. Scale bars 200 μm. |