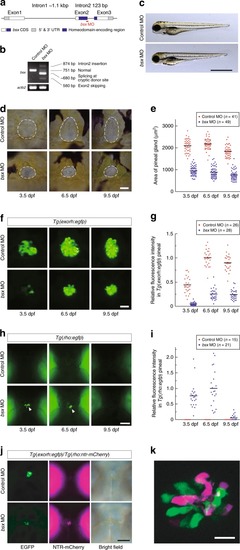
MO-mediated knockdown of bsx. a Schematic illustration of the target site of bsx MO. b RT-PCR of bsx mRNA in 48-hpf embryos injected with control or bsx MO. Full images of the electrophoreses are shown in Supplementary Fig. 8. c Apparent views of 3.5 dpf larvae injected with control or bsx MO. No gross morphological difference was detected. d–k Effects of bsx MO on the pineal gland. All the larvae are viewed dorsally with anterior to the top. Three images in each row (d, f, h) were taken from the same larva at different stages. d Size reduction of the pineal gland in bsx morphants. White dashed lines indicate the position of the pineal gland. f Reduction of pineal EGFP fluorescence in Tg(exorh:egfp) by Bsx depletion. h Induction of EGFP expression in Tg(rho:egfp) by Bsx depletion (indicated by white arrowheads). e, g, i Quantification of pineal size and fluorescence signals in bsx MO- or control MO-injected larvae. Horizontal bars indicate mean values. The difference between bsx MO-injected and control groups was statistically significant for each case [P < 2.2 × 10⁻¹⁶ (3.5, 6.5, and 9.5 dpf, e), P = 2.8 × 10⁻¹² (3.5 dpf, g), P < 2.2 × 10⁻¹⁶ (6.5 and 9.5 dpf, g), P = 2.0 × 10⁻⁸ (3.5 dpf, i), P = 1.3 × 10⁻⁷ (6.5 dpf, i), P = 0.011 (9.5 dpf, i) by Welch’s two-sided t-test]. j Effects of bsx MO on Tg(exorh:egfp);Tg(rho:ntr-mCherry) double reporter line at 5.5 dpf. In control larva, EGFP (green) and NTR-mCherry (magenta) were localized in the pineal gland and the retina, respectively. In bsx morphant, both EGFP (green) and NTR-mCherry (magenta) signals were detected in the pineal gland. k A confocal image of pineal cells in Bsx-depleted Tg(exorh:egfp);Tg(rho:ntr-mCherry), showing mutually exclusive expression of EGFP (green) and NTR-mCherry (magenta). Scale bars, 1 mm (c), 30 μm (d, f), 100 μm (h,j), 10 μm (k)
|
