FIGURE

Figure 8

ID
ZDB-FIG-191230-1794
Publication
Vicente et al., 2019 - Visualization of Mitochondrial Ca2+ Signals in Skeletal Muscle of Zebrafish Embryos with Bioluminescent Indicators
Other Figures
All Figure Page
Back to All Figure Page
Figure 8

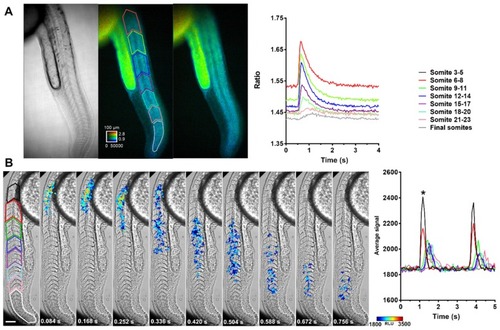
Propagation of Ca2+ transients along the trunk and tail in embryos expressing Twitch-4 and GA. (A) Transmitted light and emission ratio at rest and during a Ca2+ transient in a Twitch-4 expressing embryo at 28 hpf. The calibration square shows 100 µm, hue codes for emission ratio, and intensity codes for fluorescence. Fluorescence images were acquired at 33 Hz. ROIs were drawn over somites in groups of 3 (colored traces). The graph shows the time course of a Ca2+ transient in the indicated color-coded ROIs. (B) Snapshots of a Ca2+ transient in a GA-expressing embryo with luminescence overlaid on transmitted light images. ROIs were selected on the indicated somites in the left panel in groups of three (colored traces). Images were acquired at 11.9 Hz. The scale bar represents 100 µm. The color scale indicates RLU. The graph shows the time course of luminescence during two contractions on the indicated somites. The snapshots on the left correspond to the first contraction (*).

Expression Data

Expression Detail
Antibody Labeling
Phenotype Data

Phenotype Detail
Acknowledgments
This image is the copyrighted work of the attributed author or publisher, and ZFIN has permission only to display this image to its users. Additional permissions should be obtained from the applicable author or publisher of the image. Full text @ Int. J. Mol. Sci.