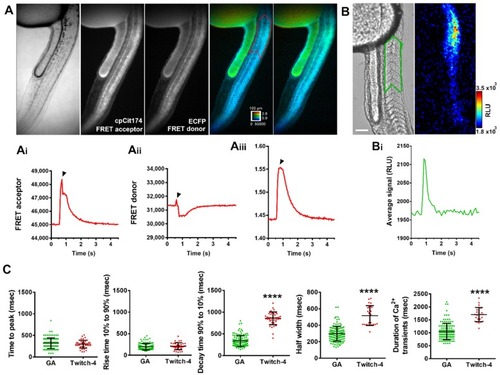
Kinetics of spontaneous Ca2+ transients in the trunk and tail in 28 hpf zebrafish embryos. (A) Representative experiment of an embryo expressing Twitch-4, imaged at 33 Hz. Left panels, transmitted light image and fluorescence FRET and donor images (cpCit174 and ECFP, respectively). Right panels, emission ratio of Twitch-4 fluorescence (FRET acceptor/donor) in pseudocolor, at rest and during the peak of a Ca2+ transient. The calibration square shows 100 µm, hue codes for emission ratio, and intensity codes for fluorescence. A region of interest (ROI, red trace) comprising somites 6–11 was used for quantification of FRET channel fluorescence (Ai), donor channel fluorescence (Aii) and fluorescence emission ratio (Aiii) during the Ca2+ transient. The black arrowheads indicate a motion artifact. (B) Transmitted light image and luminescence image during a Ca2+ spike in a GA expressing embryo. A ROI (green trace) was used for quantification of bioluminescence. (Bi) shows the Ca2+ transient measured in the ROI drawn in (B). The scale bar represents 100 µm. The color scale indicates RLU. (C) Comparison of the kinetic parameters of cytoplasmic Ca2+ transients measured with GA (bioluminescence imaged at 11.9 Hz, green points) and Twitch-4 (fluorescence acquired at 33 Hz, red points) in somites 6–11. A two-tailed unpaired t-test was used. Shown as mean ± S.D. (n = 128 transients from 3 embryos for GA; n = 25 transients from 4 embryos for Twitch-4). Statistical significance was considered for **** p < 0.0001.
|
