
Fig. 3
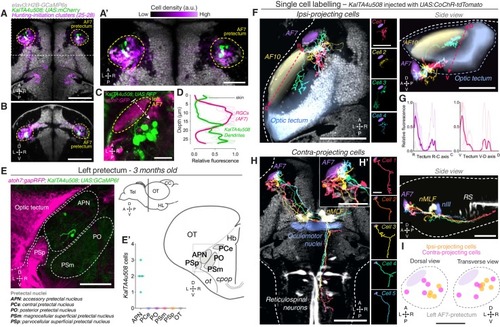
AF7-pretectal neurons with distinct projection patterns labelled by KalTA4u508. (A) Dorsal view of KalTA4u508;UAS:mCherry expression at 6 dpf (green) registered to the elavl3:H2B-GCaMP6s reference brain (grey). Neurons of all four hunting-initiation clusters combined are shown in purple, colour-coded according to local cell density (clusters 25–28, N = 6,630 cells from eight fish). AF7-pretectum is indicated in yellow and the region is enlarged in (A’). (B) Ventro-dorsal cross-section of data in (A). (C) Left AF7-pretectum in a 6 dpf KalTA4u508;UAS:RFP;atoh7:GFP larva (dorsal view, maximum-intensity projections, 10 planes, 10 µm depth). (D) Dendritic stratification of KalTA4u508 neurons (green) relative to RGC axons (magenta) in AF7. Y-axis indicates distance from the skin in µm (dashed white arrow in C). Mean and individual stratification patterns are reported (N = 4 fish). (E) KalTA4u508 neurons in pretectum of a 3 month-old KalTA4u508;UAS:GCaMP6f;atoh7:gapRFP fish. Pretectal and tectal regions in the left hemisphere are shown. Schematic indicates location of micrograph and pretectal nuclei (transverse plane). Number of KalTA4u508 cells in each pretectal nucleus are reported in (E’) (N = 4 fish). APN, accessory pretectal nucleus; CC, cerebellar corpus; cpop, postoptic commissure; Hb, habenula; HL, hypothalamic lobe; OT, optic tectum; ot, optic tract; PCe, central pretectal nucleus; PO, posterior pretectal nucleus; PSm, magnocellular superficial pretectal nucleus, PSp, parvocellular superficial pretectal nucleus; Tel, telencephalon. (F) Tracings of individual KalTA4u508 projection neurons that innervate the ipsilateral tectum (‘ipsi-projecting’ cells, N = 4 cells from four fish). Data is from 6 to 7 dpf larvae and is registered to the elavl3:H2B-GCaMP6s reference brain (grey). Selected anatomical regions from the ZBB brain atlas are overlaid. To enable morphological comparisons, all traced neurons are shown in the left hemisphere. (G) Fluorescence profiles of neurites of ipsi-projecting KalTA4u508 cells along the rostro-caudal (R-C, left) and ventral-dorsal (V-D, right) axes of the optic tectum (dashed red arrows in F). Mean and individual profiles are reported (N = 4 cells). (H) Tracings of KalTA4u508projection neurons innervating the contralateral hindbrain (‘contra-projecting’ cells, N = 5 cells from five fish). Dendritic arbours adjacent to AF7 are enlarged in inset (H’). nMLF, nucleus of the medial longitudinal fasciculus; RS, reticulospinal system. (I) Soma location of ipsi- and contra-projecting KalTA4u508 cells in AF7-pretectum. Scale bars, 100 µm, except (A’), (H’), (I), 50 µm, and (C), 20 µm. A, anterior; C, caudal; D, dorsal; L, left; P, posterior; R, right (rostral in G); V, ventral. See also Figure 3—figure supplement 1. |