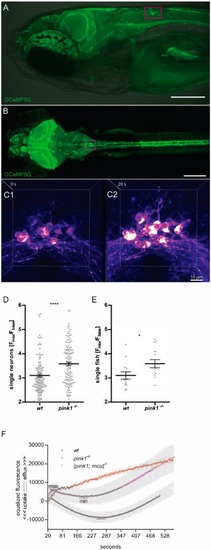
Mitochondrial calcium homeostasisis altered in pink1−/− zebrafish. (A–C) Tg(HuC:GCaMP5G) line with AP localization (A,B) and calcium efflux (C). (A) Lateral view of zebrafish head. Confocal image from GCaMP5G is merged with bright field view image. Scale bar: 100 μm. (B) Dorsal view of AP localization. In A and B, AP is highlighted with a magenta box. Scale bar: 200 μm. (C) The process of calcium efflux in AP neurons before (C1) and after (C2) CCCP treatment. Brighter color represents higher calcium concentration. Scale bar: 10 μm. (D) Fluorescence ratio of calcium released from mitochondria to the cytoplasm to the basal calcium in the cytoplasm, presented as individual single-measured neurons. (E) The same ratios, but presented as individual fish (average from nine neurons). The statistical significance (P-value) of two groups of values was calculated using a two-tailed, two-sample unequal variance t-test calculated in GraphPad Prism 5. *P<0.05, ****P<0.001. Horizontal bars are means with s.e.m. (wt: n=13 fish, n=117 neurons; pink1−/−: n=15 fish, n=134 neurons). (F) Calcium ions influx/efflux in isolated mitochondria from 24 hpf larvae. On the timeline we can compare the dynamics of calcium influx/efflux in wt, pink1−/− and (pink1; mcu)−/− mutants. Uptake in pink1−/− was lower than in wt, whereas in (pink1; mcu)−/−was completely blocked in given circumstances. Results are mean with s.e.m. [wt had 11, pink1−/− had 13, mcu−/− had three and (pink1; mcu)−/− had four independent replications] gathered during six independent experiments. Every replication was done on 200 larvae per variant.
|
