
Figure 3
- ID
- ZDB-FIG-191230-1301
- Publication
- Roca et al., 2019 - TNF Induces Pathogenic Programmed Macrophage Necrosis in Tuberculosis through a Mitochondrial-Lysosomal-Endoplasmic Reticulum Circuit
- Other Figures
- All Figure Page
- Back to All Figure Page
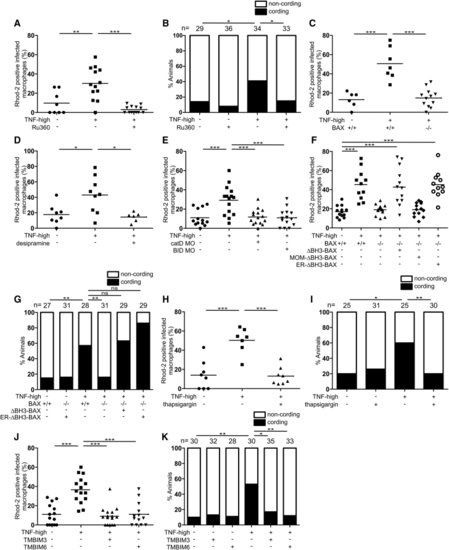
BAX Promotes Ca2+ Flow from the ER into the Mitochondrion (A) Percentage of Rhod-2-positive macrophages in 1 dpi control and TNF-high larvae treated with Ru360. Horizontal bars, means; ∗∗p < 0.01; ∗∗∗p < 0.001 (one-way ANOVA with Tukey’s post-test). Representative of 2 independent experiments. (B) Cording in 5 dpi TNF-high and control larvae treated with Ru360. ∗p < 0.05 (Fisher’s exact test). Representative of 5 independent experiments. (C) Percentage of Rhod-2-positive macrophages in 1 dpi control and TNF-high larvae that are WT or BAX mutant. Horizontal bars, means; ∗∗∗p < 0.001 (one-way ANOVA with Tukey’s post-test). Representative of 2 independent experiments. (D) Percentage of Rhod-2-positive macrophages in 1 dpi control and TNF-high larvae treated with desipramine. Horizontal bars, means; ∗p < 0.05 (one-way ANOVA with Tukey’s post-test). (E) Percentage of Rhod-2-positive macrophages in 1 dpi control and TNF-high larvae that are WT, cathepsin D, or BID morphant. Horizontal bars, means; ∗∗∗p < 0.001 (one-way ANOVA with Tukey’s post-test). Representative of 2 independent experiments. (F) Percentage of Rhod-2-positive macrophages in 1 dpi control and TNF-high larvae that are WT, BAX mutant, or BAX mutant expressing ΔBH3-BAX, MOM- or ER-targeted ΔBH3-BAX. Horizontal bars, means; ∗∗∗p < 0.001 (one-way ANOVA with Tukey’s post-test). Representative of 2 independent experiments. (G) Cording in 5 dpi TNF-high or control larvae that are WT, BAX mutant, BAX mutant expressing ΔBH3-BAX, or BAX mutant expressing ER-targeted ΔBH3-BAX. ∗∗p < 0.01 (Fisher’s exact test). Representative of 2 independent experiments. (H) Percentage of Rhod-2-positive macrophages in 1 dpi control and TNF-high larvae treated with thapsigargin. Horizontal bars, means; ∗∗∗p < 0.001 (one-way ANOVA with Tukey’s post-test). (I) Cording in 5 dpi TNF-high or control larvae treated with thapsigargin. ∗p < 0.05; ∗∗p < 0.01 (Fisher’s exact test). Representative of 3 independent experiments. (J) Percentage of Rhod-2-positive macrophages in 1 dpi control and TNF-high larvae that are WT or overexpressing TMBIM3 or TMBIM6. Horizontal bars, means; ∗∗∗p < 0.001 (one-way ANOVA with Tukey’s post-test). Representative of 2 independent experiments. (K) Cording in 5 dpi TNF-high or control larvae that are WT or overexpressing TMBIM3 or TMBIM6. ∗p < 0.05; ∗∗p < 0.01 (Fisher’s exact test). Representative of 2 independent experiments. |
Reprinted from Cell, 178(6), Roca, F.J., Whitworth, L.J., Redmond, S., Jones, A.A., Ramakrishnan, L., TNF Induces Pathogenic Programmed Macrophage Necrosis in Tuberculosis through a Mitochondrial-Lysosomal-Endoplasmic Reticulum Circuit, 1344-1361.e11, Copyright (2019) with permission from Elsevier. Full text @ Cell