|
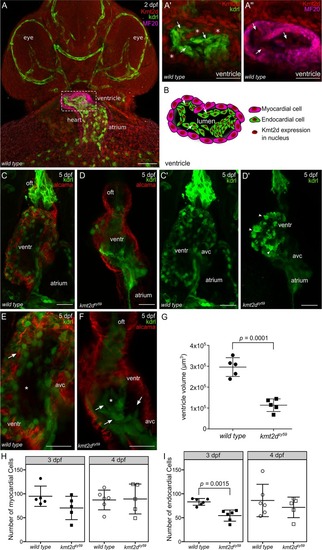
<italic>kmt2d</italic> mutants exhibit hypoplastic heart and aberrant endocardial cells morphology.(A) Confocal images of whole mount immunofluorescence for wild-type zebrafish Kmt2d protein expression at 2 dpf (ventral view). Kdrl (endothelium and endocardium) and MF20 (myosin) were use as context marker for cardiovascular tissues and myocardium. Kmt2d expression was found in the nuclei of myocardial (Aʹ, asterisk in example cells) and endocardial (A", arrows) cells in zebrafish heart (Aʹ and A" are zoomed images in ventricle area). Scale bar = 100 μm. (B) Cartoon showing Kmt2d nuclear expression in both myocardium and endocardium tissue of zebrafish heart. Arrows in Aʹ, A", and F are showing Kmt2d endocardial expression in the same set of cells. (C–D) Confocal images of wild-type tg(kdrl:GFP) sibling (C, Cʹ) and kmt2dzy59;tg(kdrl:GFP) (D, Dʹ) embryos at 5 dpf. Ventral view. kmt2dzy59 mutant had aberrant cardiac morphology with significantly reduced ventricle size (D). Myocardial cell labeled with Alcama antibody (C–D, red) showed normal cell morphology in both genotypes. Maximum intensity projections of GFP channel evidenced abnormal morphology of endocardial cells (Dʹ). Some endocardial cells exhibited cell protrusions (Dʹ, arrowheads). (E, F) High magnification images of the heart ventricle chamber in a middle-plane view from the three-dimentional data set in wild-type sibling embryo (E, higher magnification of C) and kmt2dzy59 mutant (F, higher magnification of D) at 5 dpf. Z-stack analysis of the data set revealed that endocardial cells from the ventricle are organized in concentric layers (F, arrows) filling up the cardiac lumen in kmt2dzy59;tg(kdrl:GFP) mutants (E, F, asterisk). (G) Ventricle cavity volume measurements in 5 embryos per genotype. Statistical analysis was carried out using two-tailed t test, p < 0.0001. Scale bar = 25 μm. Values for each data point can be found in S1 Data. (H, I) Ventricle myocardial (H) and endocardial (I) cells quantification at 3 and 4 dpf in zebrafish wild-type siblings and kmt2dzy59 mutants. Embryos were processed for immunofluorescence against myosine heavy chain (MF20) and GFP (Kdrl). Nuclei were stained with DAPI for cell quantification with Imaris software. (H) Myocardial cells, t tests per time point, p-values as follow: 3 dpf p = 0.129, effect size = 24.6. 4 dpf p = 0.906, effect size = −2. Bonferroni corrected p-values for 2 t tests p adjusted values, 3 dpf = 0.258 and 4 dpf = 1.000. (I) Endocardial cells, t tests per time point, p-values as follow: 3 dpf p- = 0.0007, effect size = 29. 4 dpf p = 0.4139, effect size = 14.6. Bonferroni corrected p-values for 2 t tests p adjusted values, 3 dpf = 0.0015 (value reported in figure) and 4 dpf = 0.8278. Values for each data point can be found in S1 Data. avc, atrio-ventricular canal; dpf, days post fertilization; kdrl, kinase insert domain receptor like; kmt2d, Histone-lysine N-methyltransderase 2D; oft, outflow tract; ventr, ventricle.
|