|
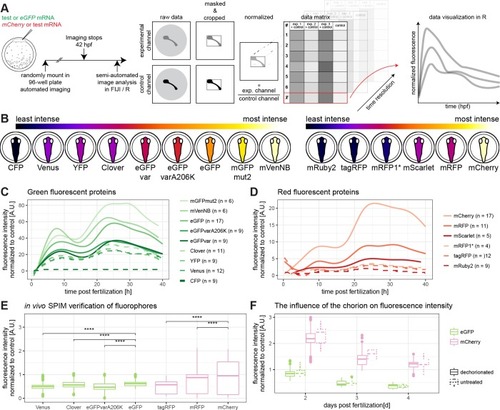
The brightest fluorescent proteins tested in medaka are mVenusNB in the green channel and mCherry in the red channel.(A) Embryos were injected with a green fluorescent protein mRNA to be tested and mCherry mRNA or with eGFP mRNA and a red fluorescent protein mRNA to be tested (1-cell stage modified from [17]). Embryos were mounted in a 96-well plate immediately after injection and automatically imaged for at least 40 h. These data were analysed semi-automated in Fiji and R. Therefore, the raw data were masked and cropped to exclude background. Subsequently, the injection volume was normalized per well by dividing with the value of the control channel at 10 hours post-fertilization. These values were plotted along their biological replicates in R. (B) Schematic overview of fluorescence intensity at 10 hpf, ordered by fluorescence intensity. The lookup table is indicated on the top of the panel, the green fluorescent proteins are shown on the left hand side and the red fluorescent proteins are shown on the right hand side (embryos modified from [17]). (C) Green fluorescent protein fluorescence comparison over time. Plotted is the fluorescence normalized to mCherry per well against the hours post fertilization. Plates were normalized by internal control for fusion of graphs (eGFP). n values indicate number of embryos used for each measurement. (D) Red fluorescent protein fluorescence comparison over time. Plotted is the fluorescence normalized to eGFP per well against the hours post fertilization. Plates were normalized to internal control for fusion of graphs (mCherry). n values indicate number of embryos used for each measurement. (E) Verification of previous results by in vivo-microscopy of hatched medaka embryos (8dpf) in a light-sheet microscope, comparing the fluorescence intensity of different fluorescent proteins (asterisks indicate P-values: **** P < = 0.0001, *** P < = 0.001, ** P < = 0.01, * P < = 0.05, ns P > 0.05, Venus N = 3 n = 1483, Clover N = 3 n = 1294, eGFPvarA206K N = 3 n = 1395, eGFP N = 2 n = 794, tagRFP N = 3 n = 1580, mRFP N = 3 n = 2158, mCherry N = 2 n = 980, N indicates number of fish, n indicates number of z-slices used for analysis). (F) The influence of the chorion on fluorescence intensity. Exemplary shown are eGFP and mCherry. There is a negligible influence of the chorion of fluorescence intensity measurement. Further information can be found in S1 Fig.
|