The brightest fluorescent proteins tested in medaka are mVenusNB in the green channel and mCherry in the red channel.

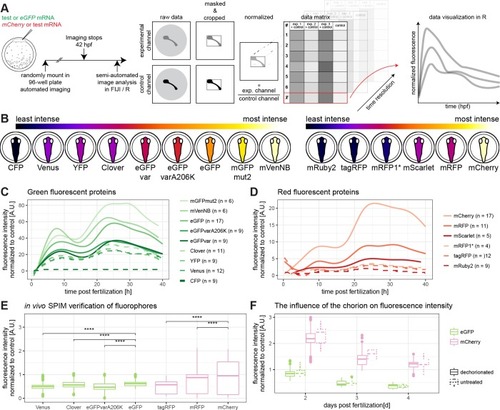
(A) Embryos were injected with a green fluorescent protein mRNA to be tested and mCherry mRNA or with eGFP mRNA and a red fluorescent protein mRNA to be tested (1-cell stage modified from [17]). Embryos were mounted in a 96-well plate immediately after injection and automatically imaged for at least 40 h. These data were analysed semi-automated in Fiji and R. Therefore, the raw data were masked and cropped to exclude background. Subsequently, the injection volume was normalized per well by dividing with the value of the control channel at 10 hours post-fertilization. These values were plotted along their biological replicates in R. (B) Schematic overview of fluorescence intensity at 10 hpf, ordered by fluorescence intensity. The lookup table is indicated on the top of the panel, the green fluorescent proteins are shown on the left hand side and the red fluorescent proteins are shown on the right hand side (embryos modified from [17]). (C) Green fluorescent protein fluorescence comparison over time. Plotted is the fluorescence normalized to mCherry per well against the hours post fertilization. Plates were normalized by internal control for fusion of graphs (eGFP). n values indicate number of embryos used for each measurement. (D) Red fluorescent protein fluorescence comparison over time. Plotted is the fluorescence normalized to eGFP per well against the hours post fertilization. Plates were normalized to internal control for fusion of graphs (mCherry). n values indicate number of embryos used for each measurement. (E) Verification of previous results by in vivo-microscopy of hatched medaka embryos (8dpf) in a light-sheet microscope, comparing the fluorescence intensity of different fluorescent proteins (asterisks indicate P-values: **** P < = 0.0001, *** P < = 0.001, ** P < = 0.01, * P < = 0.05, ns P > 0.05, Venus N = 3 n = 1483, Clover N = 3 n = 1294, eGFPvarA206K N = 3 n = 1395, eGFP N = 2 n = 794, tagRFP N = 3 n = 1580, mRFP N = 3 n = 2158, mCherry N = 2 n = 980, N indicates number of fish, n indicates number of z-slices used for analysis). (F) The influence of the chorion on fluorescence intensity. Exemplary shown are eGFP and mCherry. There is a negligible influence of the chorion of fluorescence intensity measurement. Further information can be found in S1 Fig.

Codon adaptation of <italic>eGFP</italic> for medaka is not improving fluorescence.

(A) Relative comparison of in vivo fluorescence in medaka with in vivo fluorescence in E. coli. Indicated are red, green and yellow fluorescent proteins and a diagonal line for orientation. The red, green and yellow fluorescent proteins have been normalized to the same relative values published of mRFP1*, eGFP and Venus, respectively [18]. While many of the fluorescent proteins have similar properties, some are significantly different, reinforcing the need of a systematic review of fluorescent proteins in medaka. (B) Codon adaptation indices (CAIs) of all prior used sequences. Codon adaptation index of each sequence is plotted for medaka and human along with a diagonal line for orientation. Labelled are the two normalizing fluorescent proteins eGFP and mCherry, and the outlier mRuby2. For a plot with full labelling, refer to S2 Fig. (C) Pure codon usage table driven codon averaging does not improve fluorescence intensity of fluorescent proteins. OleGFP (medaka codon-averaged eGFP) fluorescence intensity is overall lower than SceGFP (yeast codon-averaged) and 25 to 30-fold lower than eGFP. (D) Codon adaptation indices of sequences used in order to score for the effect of codon averaging. Additional to the prior used sequences are an eGFP codon optimized for medaka (OleGFP) and an eGFP codon optimized for yeast (SceGFP).

The most suitable fluorescence intensity in zebrafish varies during development.

(A) Schematic overview of the mean of the tested fluorescent proteins. The lookup table is indicated at the top of the panel, the green fluorescent proteins are shown on the left hand side and the red fluorescent proteins are shown on the right hand side (embryos modified from [22]). (B) Green fluorescent protein fluorescence comparison over time. Plotted is the fluorescence normalized to mCherry per well against the hours post fertilization. Analysis was conducted as outlined in Fig 1A. (C) Red fluorescent protein fluorescence comparison over time. Plotted is the fluorescence normalized to eGFP per well against the hours post fertilization. Analysis was conducted as outlined in Fig 1A.

Anaesthesia of medaka is most efficient with α-Bungarotoxin mRNA injection.

(A) Embryos were injected with eGFP mRNA or eGFP mRNA along with α-Bungarotoxin mRNA (1-cell stage modified from [17]). Injected embryos and uninjected embryos were dechorionated. Uninjected embryos were treated with Tricaine, Etomidate (experiments), DMSO or 1x ERM (controls). Embryos were randomly loaded in a 96-well plate and imaged automatically. Plates were adjusted by starting stage of imaging and fused into one dataset. Consecutively, image analysis was performed semi-automatically in FIJI and R. Therefore, the difference between each timepoint n and its following timepoint n+1 was calculated and squared. These values were imported into R and plotted along with their biological replicates. (B) Movement index of injected/treated embryos over time. Data was analysed as described in A. Strikingly, only α-Bungarotoxin is completely anesthetizing the embryos leading to nearly no detectable difference between the different timepoints (time resolution: 20 min, n as fish per condition is indicated in the legend). (C) α-Bungarotoxin-treated embryos are catching up in startle response ability. Fish were startled 10 times each and the number of responses was noted. Same legend as in Fig 4B applies. (α-Bungarotoxin: n = 12 fish, mock injected: n = 5 fish, wild-type control: n = 8 fish, asterisks indicate P-values: **** P < = 0.0001, *** P < = 0.001, ** P < = 0.01, * P < = 0.05, ns P > 0.05). (D) Different dilutions of α-Bungarotoxin were tested in order to adjust the concentration so fish would wake up after microscopy. Embryos were injected with 0, 3, 6, 12 or 25 ng/μl α-Bungarotoxin mRNA along with eGFP mRNA as an injection control. The number of hatched embryos per condition was scored (0 ng/μl: n = 33 fish, 3 ng/μl: n = 34 fish, 6 ng/μl: n = 16 fish, 12 ng/μl: n = 24 fish, 25 ng/μl: n = 22 fish).

The acute double pigment knockout utilizing the CRISPR/Cas9-system can be deployed in the injected generation.

(A) Medaka zygotes were microinjected with Cas9 mRNA and an injection mix according to Table 1. The injected embryos were scored for suitability for imaging either in the brightfield or in the green fluorescent spectrum. The ratio of the embryos suitable for imaging was determined and noted in panel B. (B) Transient targeting efficiency depends on the number of sgRNAs per gene. Compare op_1 and op_2. (C) By visual inspection no difference in pigmentation is observed between Oca2-/- or Tyr-/-, as well as Pax7a-/-Slc2a15b-/- embryos. (D) Medaka injected with the mix op_1 were raised, screened and imaged in F1 to compare the effects of sgRNA injection to wild-type. Wild-type embryos exhibit a dense, black pigment in the eyes, whereas adults additionally exhibit a non-translucent peritoneum. Fish injected with sgRNAs against oca2 and pnp4a show dramatic loss of pigmentation surrounding the eye and the peritoneum, rendering the fish more accessible for microscopy.

The established toolbox enables imaging of previously challenging organs and tissues, such as the retina and the brain.

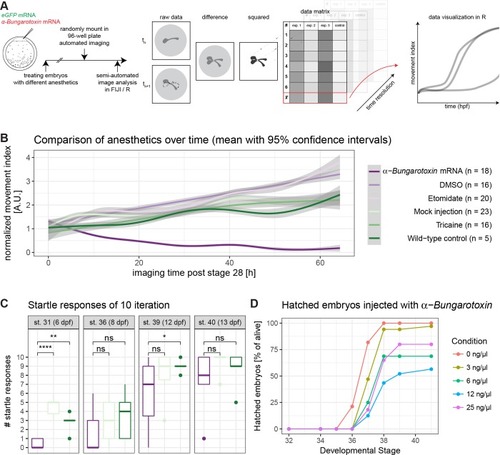
Using the pigment double knockout in combination with α-Bungarotoxin, eGFP and mCherry coupled to histone2a the imaging was conducted in a single plane illumination microscope (SPIM) we could image the head region of wild-type and spooky embryos. Hollow arrowheads point towards the eyes in A and B. (A) Maximum projection of H2A-mCherry signal of a lateral view of a wild-type medaka embryo. The eye is not penetrable and no nuclei are visible within or behind it. (A') Maximum projection of H2A-mCherry signal of a lateral view of a spooky medaka embryo. The eye is penetrable and nuclei are visible within or behind it. (B) Stitched maximum projections of a dorsal view of a spooky embryo. This embryo was imaged for 48 hours, which can be seen in S3 Movie.

Acknowledgments
This image is the copyrighted work of the attributed author or publisher, and ZFIN has permission only to display this image to its users. Additional permissions should be obtained from the applicable author or publisher of the image. Full text @ PLoS One