
Fig. 4
- ID
- ZDB-FIG-191219-3
- Publication
- Jin et al., 2019 - Dysregulation of Microglial Function Contributes to Neuronal Impairment in Mcoln1a-Deficient Zebrafish
- Other Figures
- All Figure Page
- Back to All Figure Page
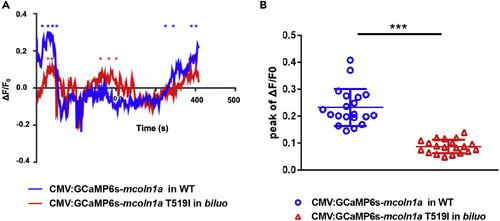
The T519 to I Mutation Reduces Mcoln1a-Mediated Ca2+ Efflux (A) Representative calcium efflux of WT (blue) and mutant Mcoln1a channel. Stars represent calcium peaks we quantified. (B) Quantification of the mean of the peak of ΔF/F0 (representing Trpml1a-mediated Ca2+efflux) in the macrophages in WT embryos injected with WT CMV:GCaMP6s-mcoln1a construct (blue dots) and the macrophages in biluo mutants injected with mutant CMV:GCaMP6s-mcoln1aT519I (red triangles). ΔF/F0 is calculated as (F-F0)/F0, where F0 is the baseline fluorescence signal. Error bars represent mean ± SD. n(WT late endosome) = 20 from 8 macrophages, n(biluo late endosome) = 20 form 7 macrophages. |
| Fish: | |
|---|---|
| Observed In: | |
| Stage: | Pec-fin |