
Fig. 2
- ID
- ZDB-FIG-190723-1537
- Publication
- Jin et al., 2019 - Dysregulation of Microglial Function Contributes to Neuronal Impairment in Mcoln1a-Deficient Zebrafish
- Other Figures
- All Figure Page
- Back to All Figure Page
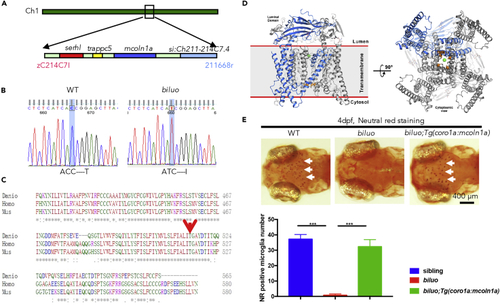
The Microglia Defect in biluo Mutants Is Caused by a Point Mutation in mcoln1a (A) Positional cloning maps the biluo mutation to an 82-kb region on chromosome 1 between two SSLP markers, zC214C7I and 211668r. This region contains four genes: serhl, trappc5, mcoln1a, and si:Ch211-214C7.4. (B) Sequencing the coding regions of the four candidate genesrevealed a C to T point mutation in the mcoln1a gene, which leads to the change of amino acid T519 to (I). (C) Alignment of human (Homo) MCOLN1, mouse (Mus) MCOLN1, and zebrafish (Danio) Mcoln1a protein sequence. Red arrow indicates the conserved 519th Threonine. (D) 3D structural model of Mcoln1a channel. Green dot represents the central pore, and orange dots indicate the amino acid T519, which is mutated to I in biluo mutants. (E) Neutral red (NR) staining of 4-dpf Tg(coro1a:mcoln1a);biluoembryos indicates that the neutral red staining defect of microglia in biluo mutants can be rescued by ectopically expressing WT mcoln1a in microglia. White arrows represent microglia. Quantification data of neutral-red-positive microglia number in 4-dpf siblings, biluo mutants, and biluo;Tg(coro1a:mcoln1a) embryos. n(sibling) = 5 embryos, n(biluo) = 5 embryos, n(biluo;Tg(coro1a:mcoln1a)) = 5 embryos. ***p < 0.001, ANOVA. Error bars represent mean ± SD. |