
Fig. 5
- ID
- ZDB-FIG-190822-31
- Publication
- Sanz-Morejón et al., 2019 - Wilms Tumor 1b Expression Defines a Pro-regenerative Macrophage Subtype and Is Required for Organ Regeneration in the Zebrafish
- Other Figures
- All Figure Page
- Back to All Figure Page
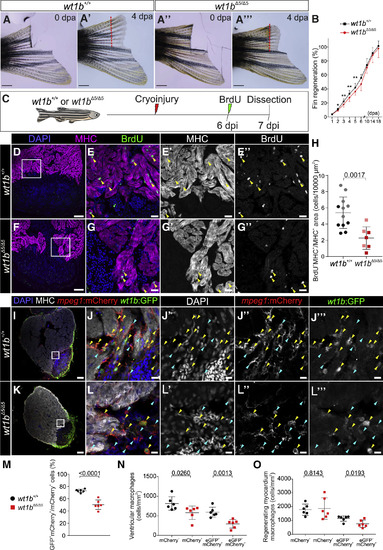
Heart and Fin Regeneration Are Impaired in wt1b Mutants (A–A’’’) Caudal fin amputation was performed to wild-type wt1b+/+and mutant wt1bΔ5/Δ5 adult fish. Fin regrowth was assessed until complete regeneration at 18 dpa. Shown are representative examples at 0 dpa (A and A’’) and 4 dpa (A’ and A’’’). The red dotted line represents the amputation plane. (B) Quantification of fin regeneration. The 3 most regrown rays were measured per animal and normalized by the initial amputated fin length. The data are from 2 independent experiments: experiment 1 (1–18 dpi), wt1b+/+ = 7 and wt1bΔ5/Δ5 = 5; experiment 2 (1–6 dpi), wt1b+/+ = 10 and wt1bΔ5/Δ5 = 10. Means ± SDs are shown; two-tailed unpaired t test (∗p < 0.05 and ∗∗p < 0.01). (C) Ventricular cryoinjury was performed on wt1b+/+ and wt1bΔ5/Δ5adult fish, and cardiomyocyte proliferation was assessed from 6 to 7 dpi by BrdU incorporation. (D–G’’) IF staining on sections of wt1b+/+ (D–E’’) and wt1bΔ5/Δ5 hearts (F–G’’). Nuclei were counterstained with DAPI. (E)–(E’’) and (G)–(G’’) are merged and single channels of boxed areas in (D) and (F), respectively. (H) Quantification of cardiomyocyte proliferation. The light- and dark-colored dots represent animals from two independent experiments. Means ± SDs are shown. Two-tailed unpaired Student’s t test. (I–O) Localization of wt1b:eGFP;mpeg1:mCherry cells in cryoinjured wt1b+/+ and mutant wt1bΔ5/Δ5 hearts at 7 dpi. (I–L’’’) IF staining at 7 dpi heart sections. Nuclei were counterstained with DAPI. Shown are whole heart sections (I and K) and magnified views of merged and single channels (J–J’’’ and L–L’’’). The yellow arrowheads indicate double-positive cells, and the blue arrows indicate mpeg1:mCherry+ cells. (M) The percentage of wt1b:eGFP+;mpeg1:mCherry+/mpeg1:mCherry+cells per heart section. (N) Quantification of the number of single- and double-positive cells per area in whole heart sections. (O) Quantification of the number of single- and double-positive cells in the regenerating myocardium defined as the area of 100 μm adjacent to the injury. In all of the graphs, each dot represents data from one heart section with the maximum injury area. n = 6 hearts analyzed per group from 1 experimental replicate. Means ± SDs are shown; two-tailed unpaired t test. Scale bars, 1 mm (A–A’’’), 100 μm (D, F, I, and K), 20 μm (E–E’’ and G–G’’), and 10 μm (J–J’’’ and L–L’’’). BrdU, 5′-bromo-2′-deoxyuridine; dpa, days post-amputation; dpi, days post-injury; MHC, myosin heavy chain. |
| Fish: | |
|---|---|
| Conditions: | |
| Observed In: | |
| Stage: | Adult |