FIGURE

Fig. 2

ID
ZDB-FIG-190725-86
Publication
Viau et al., 2018 - Cilia-localized LKB1 regulates chemokine signaling, macrophage recruitment, and tissue homeostasis in the kidney
Other Figures
All Figure Page
Back to All Figure Page
Fig. 2

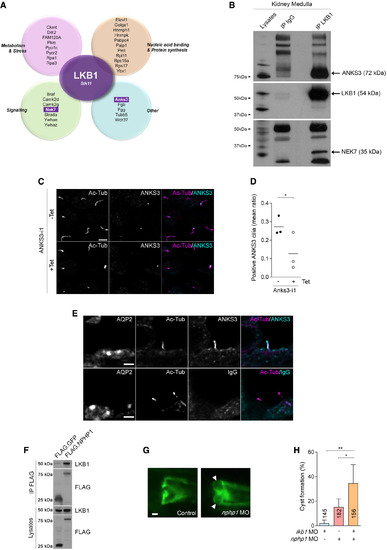
LKB1 interacts with ANKS3, NEK7, and NPHP1

  1. LKB1 interactors identified by a proteomic screen in mouse kidney medulla. See also Datasets EV1 and EV2.
  2. Immunoprecipitates (IP) from mouse kidney medulla. ANKS3 and NEK7 are enriched in the LKB1 precipitates. Representative Western blot of three independent experiments. Expected molecular weights: ANKS3 (72 kDa), LKB1 (54 kDa), and NEK7 (35 kDa).
  3. Representative confocal microscopy images of primary cilia (acetylated tubulin expressing, Ac‐Tub) and ANKS3 in MDCK cells expressing inducible shRNA against Anks3 (Anks3‐i1) after tetracycline induction (Tet). Scale bar: 5 μm. See also Appendix Fig S3F.
  4. Quantification of ANKS3‐positive primary cilia in Anks3‐i1 MDCK cells. Blinded quantification of five fields of view per biological replicate.
  5. Confocal microscopy images of collecting duct (AQP2 expressing) from 5‐week‐old wild‐type mice. Anti‐ANKS3 antibody (upper panel), but not control IgG (lower panel), detects a signal in cilia (Ac‐Tub). Representative images of = 5 mice. Scale bar: 5 μm.
  6. IP from HEK 293T cells. Endogenous LKB1 is enriched in the precipitates of FLAG‐NPHP1. Representative Western blot of three independent experiments. See also Fig EV2A–C.
  7. Zebrafish embryos injected with control morpholino (MO) or MO targeting nphp1at 48 h post‐fertilization. Arrowheads indicate pronephric cysts. Scale bar: 100 μm.
  8. Quantification of embryos with pronephric cysts. Numbers in bars represent n analyzed embryos.
Data information: In (D), each circle represents one biological replicate. Bars indicate mean. Paired t‐test, *< 0.05. In (H) mean ± SD. ANOVA followed by the Tukey–Kramer test, *< 0.05, **< 0.01.

Expression Data

Expression Detail
Antibody Labeling
Phenotype Data
Fish:
Knockdown Reagents:
Observed In:
Stage: Long-pec

Phenotype Detail
Acknowledgments
This image is the copyrighted work of the attributed author or publisher, and ZFIN has permission only to display this image to its users. Additional permissions should be obtained from the applicable author or publisher of the image. Full text @ EMBO J.