
FIGURE
Fig. 3
- ID
- ZDB-FIG-190717-26
- Publication
- Chan et al., 2019 - Development of enhancer-trapping and -detection vectors mediated by the Tol2 transposon in zebrafish
- Other Figures
- All Figure Page
- Back to All Figure Page
Fig. 3
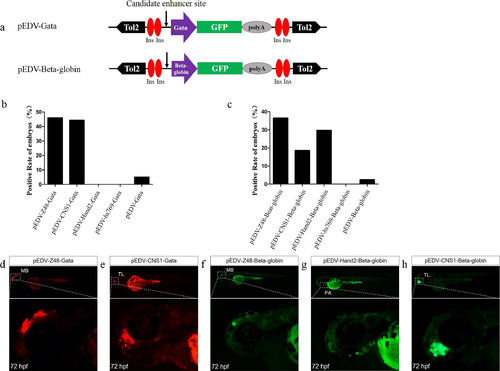
Capacity of the Gata and Beta-globin minimal promoters to respond to different enhancers.(A) Diagram of the enhancer-detection vectors based on the Gata or Beta-globin minimal promoter. (B) mCherry expression rate in embryos injected at 72 hpf with the Gata minimal promoter carrying four enhancers (Z48, Hand2, Hs769 and CNS1) or no enhancer. (C) GFPexpression rate in embryos injected at 72 hpf with Beta-globin carrying three enhancers (Z48, Hand2 and Hs769) or no enhancer. (D and E) mCherry expression in the midbrain (MB) and telencephalon (TL) of embryos. (F–H) GFP expression in the midbrain (MB), pharyngeal arch (PA) and telencephalon (TL) of embryos. |
Expression Data
Expression Detail
Antibody Labeling
Phenotype Data
Phenotype Detail
Acknowledgments
This image is the copyrighted work of the attributed author or publisher, and
ZFIN has permission only to display this image to its users.
Additional permissions should be obtained from the applicable author or publisher of the image.
Full text @ Peer J.