
- Title
-
Development of enhancer-trapping and -detection vectors mediated by the Tol2 transposon in zebrafish
- Authors
- Chan, S., Shen, D., Sang, Y., Wang, S., Wang, Y., Chen, C., Gao, B., Song, C.
- Source
- Full text @ Peer J.
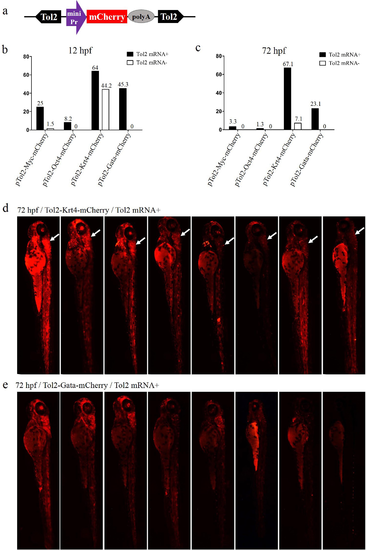
Comparison of the enhancer-trapping efficiency of four minimal promoters in zebrafish embryos.(A) Diagram of the ET vector. The frame contains an ET box flanked by Tol2 TIRs. The ET box contained a minimal promoter, the mCherry ORF and the SV40 polyA. The purple arrow represents the four minimal promoters (Myc, Oct4, Krt4 and Gata), respectively. (B and C) Proportion of mCherry-expression-positive embryos injected with ET vectors at 12 and 72 hpf. Embryos at the one-cell stage were co-injected with ET plasmids (20 pg/nL) mixed with the Tol2 mRNA (30 pg/nL) or were injected with enhancer plasmids (20 pg/nL) alone. (D) mCherry expression in embryos injected with the ET vector carrying the Krt4 minimal promoter at 72 hpf; the white arrow denotes the re-occurring pattern detected in the cerebellum. (E) mCherry expression in embryos injected with the ET vector carrying the Gata minimal promoter at 72 hpf. |
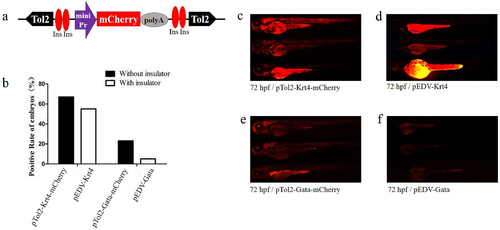
Functional assay of the chicken “5′HS4” insulators in the enhancer-detection vector.(A) Diagram of the zebrafish enhancer detection vector (pEDV). The frame contains two copies of the chicken “5′HS4” insulators (Ins, shown in red ovals), which flanked the ET box. (B) mCherry expression rate among embryos injected with the four vectors at 72 hpf: two vectors that included insulators (pEDV-Krt4 and pEDV-Gata) and two vectors that did not include insulators (pTol2-Krt4-mCherry and pTol2-Gata-mCherry). (C–F) mCherryexpression in the embryos injected with the various vectors. |
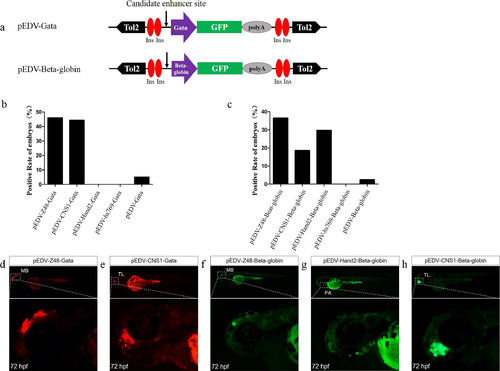
Capacity of the Gata and Beta-globin minimal promoters to respond to different enhancers.(A) Diagram of the enhancer-detection vectors based on the Gata or Beta-globin minimal promoter. (B) mCherry expression rate in embryos injected at 72 hpf with the Gata minimal promoter carrying four enhancers (Z48, Hand2, Hs769 and CNS1) or no enhancer. (C) GFPexpression rate in embryos injected at 72 hpf with Beta-globin carrying three enhancers (Z48, Hand2 and Hs769) or no enhancer. (D and E) mCherry expression in the midbrain (MB) and telencephalon (TL) of embryos. (F–H) GFP expression in the midbrain (MB), pharyngeal arch (PA) and telencephalon (TL) of embryos. |