
Fig. 1
- ID
- ZDB-FIG-190717-24
- Publication
- Chan et al., 2019 - Development of enhancer-trapping and -detection vectors mediated by the Tol2 transposon in zebrafish
- Other Figures
- All Figure Page
- Back to All Figure Page
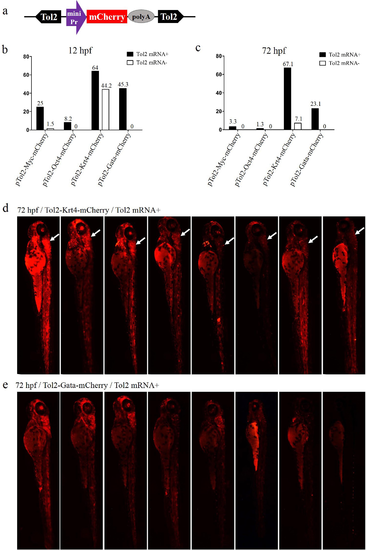
Comparison of the enhancer-trapping efficiency of four minimal promoters in zebrafish embryos.(A) Diagram of the ET vector. The frame contains an ET box flanked by Tol2 TIRs. The ET box contained a minimal promoter, the mCherry ORF and the SV40 polyA. The purple arrow represents the four minimal promoters (Myc, Oct4, Krt4 and Gata), respectively. (B and C) Proportion of mCherry-expression-positive embryos injected with ET vectors at 12 and 72 hpf. Embryos at the one-cell stage were co-injected with ET plasmids (20 pg/nL) mixed with the Tol2 mRNA (30 pg/nL) or were injected with enhancer plasmids (20 pg/nL) alone. (D) mCherry expression in embryos injected with the ET vector carrying the Krt4 minimal promoter at 72 hpf; the white arrow denotes the re-occurring pattern detected in the cerebellum. (E) mCherry expression in embryos injected with the ET vector carrying the Gata minimal promoter at 72 hpf. |