|
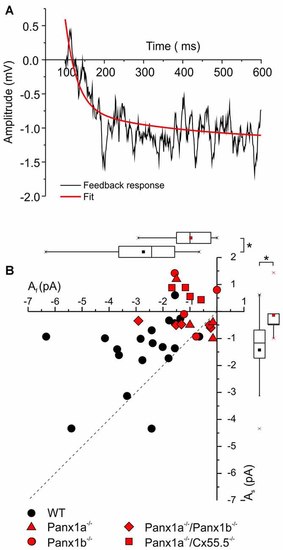
Quantification of the two feedback components. A double exponential function was fitted through the feedback responses (See “Materials and Methods” section). (A) Representative feedback trace (black) with fitted curve (red). (B) Scatter plot of the fast (x-axis) and the slow (y-axis) feedback component for WT (black symbols) and the Panx1−/− animals combined (red symbols). The dotted line indicates equal amplitude for the fast and the slow feedback component. All the WT points are above this line, indicating that the amplitude of the fast feedback component is the largest. In the Panx1−/− animals both the fast and the slow feedback component are significantly reduced. *p < 0.05.
|