
FIGURE
Fig. 8
- ID
- ZDB-FIG-190618-62
- Publication
- Richardson et al., 2019 - Transcriptome profiling of zebrafish optic fissure fusion
- Other Figures
- All Figure Page
- Back to All Figure Page
Fig. 8
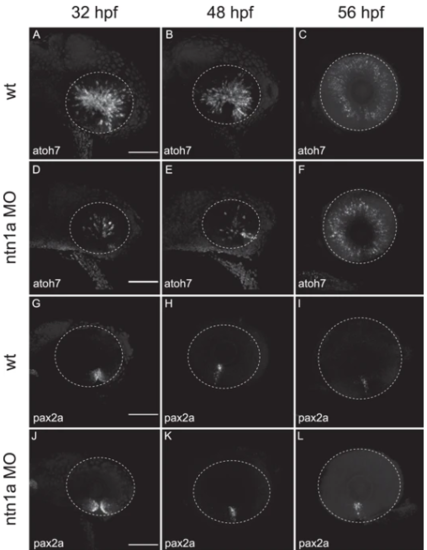
Expression analysis of ntn1a morphant embryos through optic fissure fusion. Representative images of in situ hybridisation in wild-type and ntn1a morphant zebrafish retina using mRNA probes for (A–F) atoh7 and (G–L) pax2a at 32, 48 and 56 hpf. White dotted lines indicate the circumference of the eye. Scale bar 50 µm. |
Expression Data
| Genes: | |
|---|---|
| Fish: | |
| Knockdown Reagent: | |
| Anatomical Terms: | |
| Stage Range: | Prim-15 to Long-pec |
Expression Detail
Antibody Labeling
Phenotype Data
| Fish: | |
|---|---|
| Knockdown Reagent: | |
| Observed In: | |
| Stage Range: | Prim-15 to Long-pec |
Phenotype Detail
Acknowledgments
This image is the copyrighted work of the attributed author or publisher, and
ZFIN has permission only to display this image to its users.
Additional permissions should be obtained from the applicable author or publisher of the image.
Full text @ Sci. Rep.