
Fig. 6
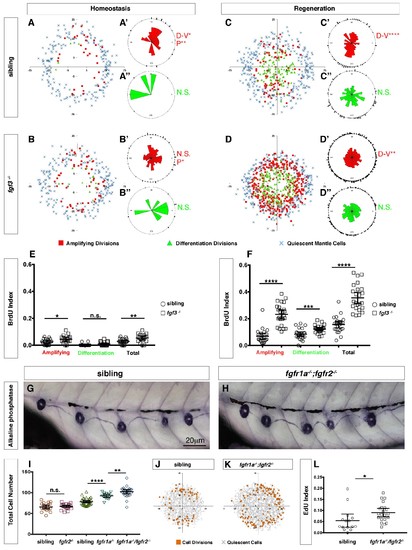
Loss of fgf3-/- causes increased support cell proliferation during homeostasis and regeneration.(A–B) Spatial analysis of amplifying (red squares), differentiation (green triangles) cell divisions and quiescent mantle cells (blue X’s) in sibling and fgf3-/- neuromasts during homeostasis. Quiescent and BrdU-positive cells from 18 neuromasts are superimposed onto the same X-Y plane. N.S. = not significant. (A’–B’’) Rose diagrams of the angular positions of BrdU(+) support cells (red) or hair cells (green) in sibling and fgf3-/- during homeostasis. D/V clustering and directional bias to the posterior was analyzed with a Binomial distribution test, *p<0.05, **p<0.008. (C–D) Spatial analysis of amplifying and differentiation cell divisions or quiescent mantle cells in sibling and fgf3-/- 24 hrs post neomycin. (C’–D’’) Rose diagrams of the angular positions of BrdU-positive support cells or hair cells in sibling or fgf3-/- 24 hrs post neomycin. D/V clustering and directional bias to the posterior was analyzed with a Binomial distribution test, ****p<0.00001, **p<0.008 (E) BrdU index of amplifying, differentiating and total cell divisions in sibling and fgf3-/- during homeostasis. Error bars show 95% CI. p-value determined by unpaired t-test, *p<0.03, **p<0.007. (F) BrdU index of amplifying, differentiating and total cell divisions in siblings and fgf3-/- mutants during 24 hrs post neomycin treatment. Error bars show 95% CI. p-value determined by unpaired t-test, ***p<0.0005, ****p<0.0001. (G–H) Alkaline phosphatase staining of sibling or fgfr1a-/-/fgfr2-/- at 5dpf. (I) Quantification of total neuromast cell number at 5dpf in siblings, fgfr2-/-, fgfr1a-/- and fgfr1a-/-/fgfr2-/-. Error bars show 95% CI. p-value determined by unpaired t-test, **p<0.007, ****p<0.0001. (J–K) Spatial analysis of all cell divisions (orange squares) or quiescent cells (grey X) in sibling or fgfr1a/fgfr2-/-during homeostasis. (L) EdU index of total cell divisions in siblings and fgfr1a/fgfr2-/- mutants during homeostasis. Error bars show 95% CI. p-value determined by unpaired t-test, *p=0.03. |
| Fish: | |
|---|---|
| Condition: | |
| Observed In: | |
| Stage Range: | Day 5 to Day 6 |